
 Introduction
The Amsterdam Exchanges Index (AEX), the main index of Euronext Amsterdam, produced a tremendous performance in the period from December 1987 to August 1998 relative to the MSCI World Index. The cumulative outperformance in that period was 165%, which is equal to an annual compounded average of 9.5%. However, coinciding remarkably neatly with the introduction of the euro, the outperformance abruptly came to an end in 1999 with a 14% underperformance.
In this article we examine the relative performance of the AEX from its inception in 1983 up until 2002. During this period the average annual compounded outperformance was 2.8%. We will try to identify the factors that could have played a role in the relative performance of the AEX. We consider the investment policy of Dutch institutional investors, as well as the specific AEX sector mix, the sensitivity of the AEX to the dollar, the bond yield and the global stock market. In our analysis we use the AEX Index, the main index of Euronext Amsterdam, as it is the bestknown index of Dutch blue-chip stocks. We have structured the article as follows. In the next section we will discuss the long-term relative performance of the AEX in more detail and offer several hypotheses to explain its relative performance pattern. We will then discuss our data and methodology, followed by a discussion of our empirical findings. Finally, we end with a summary and our conclusions.
History and Hypotheses
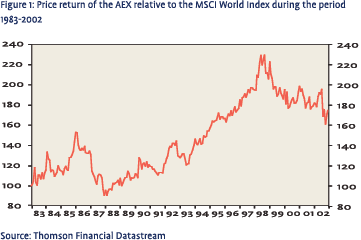 History – The AEX Index is a capped market-capitalization weighted index comprising the 25 most actively traded shares on Euronext Amsterdam1 , and includes blue chips such as Royal Dutch, Philips and ING. Figure 1 shows the price return of the AEX relative to the MSCI World Index from 1983 to 2002.
In the period from December 1987 to August 1998 the AEX realized a fabulous outperformance that averaged 9.5% a year and cumulated to 165%2. The AEX outperformed all country constituents in the MSCI World Index during this period. The peak in the relative outperformance approximately coincides with the introduction of the euro. From the peak in August 1998 until April 2000 the AEX lagged the market by 25%. Subsequently, from May 2000 on the AEX has shown an underperformance. For the whole sample period from 1983 to 2002 the AEX outperformed the MSCI World index by 74%, which equals 2.8% a year.
Hypotheses – In this section we discuss five hypotheses that we examined.
 Investment policy of Dutch institutional investors
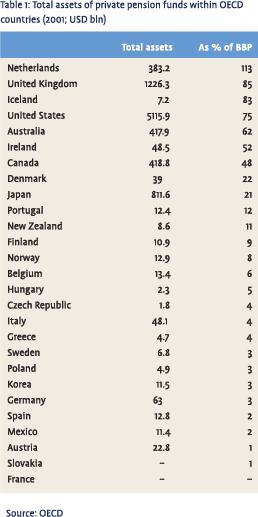
As table 1 shows, Dutch pension provisions are the wealthiest in the world. The total assets of private pension funds represent 113% of GDP, significantly more than the United Kingdom (85%), the United States (75%), Japan (21%) or Germany (3%). The investment policy could therefore have affected stock-market performance. During the nineties, Dutch institutional investors, pension funds as well as insurers, significantly increased the equity exposure in their asset mix. In addition, they initially had a severe home bias. However, the introduction of the euro enlarged the investment universe without currency risk, and they therefore decided to diversify internationally. Because of the size of institutional investors’ portfolios relative to the domestic stockmarket capitalization, their investment policy could have affected the relative performance of the Dutch stock market.
H1: The relative performance of the AEX is positively correlated to the net buying or selling of domestic stocks by Dutch institutional investors.
Sector mix
Differences in sector weights between the AEX and the MSCI World Index might contribute to differences in performance. For example, the AEX is overweight in financials and energy and underweight in utilities and pharmaceuticals. Moreover, the importance of sectors has been increasing over time due to globalization (see Blitz et al. (2000) for example). Hence the sector mix has become more significant.
H2a: The relative performance of the AEX is positively correlated to the specific sector mix of the AEX.
H2b: The correlation between the relative performance of the AEX and the sector mix is higher in the latter part of the sample.
US dollar
The Netherlands has a relatively open economy, and several Dutch blue chips have major operations in the United States. The AEX might therefore be more sensitive than most other indices to changes in the euro-dollar exchange rate. Moreover, this may have increased in the latter part of the sample period, when Dutch companies were extremely active in buying US firms3. Globalization should also have resulted in an increasing sensitivity to dollar movements.
H3a: The relative performance of the AEX is negatively correlated to changes in the euro-dollar exchange rate (a strong euro is negative for the AEX).
H3b: The correlation between the relative performance of the AEX and changes in the euro-dollar exchange rate is higher in the latter part of the sample.
Bond yield
The AEX could have a different sensitivity to bond yields than the MSCI World Index. This could be due, for example, to differences in average debt-to-equity ratios. Alternatively the presence of value and growth stocks, with growth stocks being more sensitive to changes in interest rates, might not correspond to the market average.
H4: The relative performance of the AEX is correlated to changes in bond yields.
Market sensitivity
The AEX could have a different risk profile than the market average, and hence a different sensitivity to global market developments.
H5: The relative performance of the AEX is dependent on the global market’s return.
Data
 Institutional money
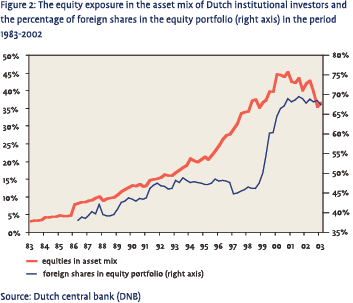
The quarterly report of De Nederlandsche Bank (DNB), the Dutch central bank, contains balancesheet data for Dutch insurers and pension funds. From this source we can establish the percentage of equities in their asset mix as well as their foreign stock holdings. Figure 2 shows that the equity exposure of Dutch institutional investors increased from 3% (!) at the end of 1982 to 37% in 2002. During the same period, investment in foreign stocks rose to 68% of the total equity portfolio, as also illustrated in figure 2. This preference for foreign stocks increased particularly sharply in 1999. In a relatively short period of only six quarters, the weight of foreign stocks increased from 47% at the end of 1998 Q3 to 67% at the end of 2000 Q1. Before 1999, Dutch institutional investors had a severe home bias in their equity portfolios.
Statistical imperfections mean that the balancesheet data can not be used to calculate flow data. The central bank cites changes in the reporting population of institutional investors, and translation problems, i.e. differences between the closing value and the opening value in successive quarters of reporting entities, which prevent us from calculating flow data from stock data. However, the Centraal Bureau voor de Statistiek (CBS), the Dutch national statistical agency, does provide annual flow data.
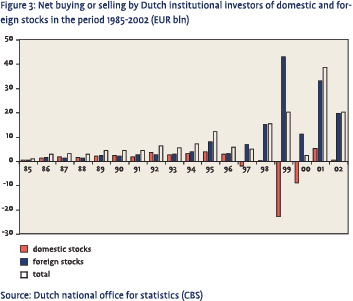 These data are available from 1985 up to 2002 and are shown in figure 3. As the graph shows, there was exceptionally heavy selling of domestic stocks in 1999 especially, and to a lesser extent in 2000. In 1999 Dutch insurers and pension funds sold EUR 23 billion worth of domestic stocks, which amounted to 4.8% of the total market capitalization of all AEX Index constituents. In that same year, they bought foreign stocks worth EUR 43 billion. This period coincides with the introduction of the euro.
Sector mix
To estimate the effect of the sector mix we constructed a quarterly index series in which we multiplied all relative industry group weights by the relative performance of the corresponding MSCI World Industry Group Index. This series therefore indicates how much of the return of the AEX is derived from over- and underweights in industry groups relative to the MSCI World Index.
We calculated the quarterly sector-mix series on the basis of the composition of the AEX at the end of each quarter. Consequently, we did not take into account any changes in the composition of the AEX Index during the quarter, but this introduces only a minor bias. The AEX Index is revised annually at the close of the first trading day in March4, while we have adjusted our sector-neutral AEX Index at the end of March. At the time of the revision we estimate that around 10% of the index weight is shifted, see Doeswijk (2005). In other words, during March we do not derive the exact sector-neutral performance, but this does not significantly affect our analysis as it only concerns a small part of the index. Euronext Amsterdam provided an overview of the historical index constituents.
The dollar, the bond yield and the market
We used the Dutch guilder-US dollar exchange rate for the period before 1999 and the euro-dollar exchange rate from 1999 on. For bond yields we used the tenyear benchmark rate. To estimate any possible over- or underexposure of the AEX to the global stock market we used the MSCI World Index in euros. All these data were derived from Thomson Financial Datastream.
Methodology
We used ordinary least-squares regression analysis with an annual and a quarterly frequency. The analysis based on annual data starts in 1985 and ends in 2002. It is only in this analysis that we take the institutional money factor into account. For the analysis with quarterly data our sample starts at the beginning of January 1983 and ends at the end of December 2002. We have also split this period in two ten-year sub-samples, the first from 1983 to 1992 and the other from 1993 to 2002. In this way we can test the robustness of our results and see whether there was an increase in the sector mix or dollar coefficient in the latter part of the sample as hypothesized earlier. We show p-values of two-sided significance tests for all regression coefficients according to standard practice in statistics.
In our analysis we used log data for the performance of the AEX relative to the MSCI World Index for the sector-mix series and for the changes in the dollar, the bond yield and the world market index. For net buying or selling by institutional investors, we express the net amount bought or sold during a year as a percentage of the market capitalization of the AEX.
 Empirical Results
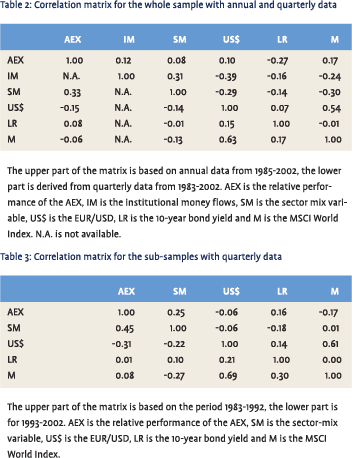
Table 2 shows the correlation between the variables we used in the analysis. The upper part of the matrix contains the correlation coefficients based on the annual data, while the lower part is derived from the quarterly data. The correlations between the relative performance of the AEX and the explanatory variables are low, whether based on the annual data or the quarterly data. The sector mix shows the greatest correlation, with a coefficient of 0.33 using quarterly data. Remarkably, with the exception of the sector mix, all coefficients have opposite signs for the yearly and quarterly correlations with the AEX. The correlations between the explanatory variables themselves are low, except for the euro-dollar exchange rate and the MSCI World Index in euros, which is 0.63 for the whole sample using quarterly data.
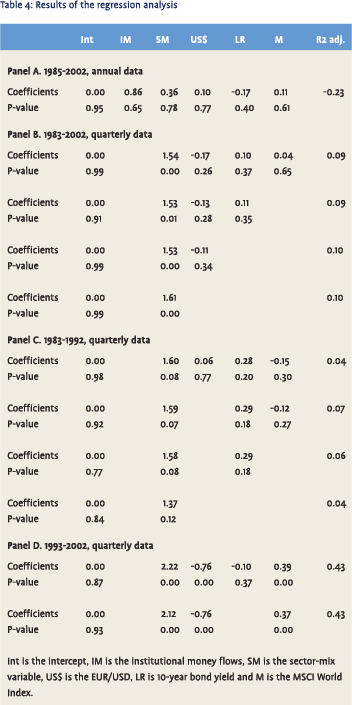
Table 3 contains the correlation coefficients for both ten-year period sub-samples with quarterly data. The upper part of the matrix contains the correlation coefficients for the period 1983-1992 and the lower part those for 1993-2002. The correlation coefficients with the AEX for both the sector mix and changes in the dollar increase in the second half of the sample. The sector-mix coefficient increases from 0.25 to 0.45 while the coefficient for the dollar increases, in absolute terms, from 0.06 to 0.31. The interest-rate coefficient declines from 0.16 to 0.01. For the market, the correlation with the relative performance of the AEX changes from -0.17 to 0.08. The correlation between the dollar and the market is approximately the same for the first and second part of the sample, with coefficients of 0.61 and 0.69. We will discuss the results of the regression analysis below, starting with the regressions based on annual data.
Annual Frequency
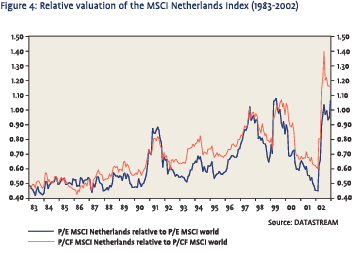
 Panel A in table 4 shows the regression results for the 1985-2002 period with annual data. None of the coefficients appear to be significant. The sign of the coefficient for the dollar is in fact the opposite of what we expected. After using backward selection by deleting the most insignificant variable step by step from the regression, the results remain insignificant. All single regression analyses also produce insignificant results. Although we believe that institutional money, the sector mix and the dollar do in fact at least play a role, this theory is not supported by the results. Since this may be due to a lack of data, we will now examine the quarterly results. Unfortunately, as mentioned previously, quarterly data are not available for institutional money flows.
Quarterly Frequency
As panel B in table 4 shows, the sector mix becomes significant when we run the regression analysis using quarterly data. But again, other variables are unable to explain the outperformance of the AEX. The sector-mix coefficient is larger than we would expect if the relative performance of the AEX was entirely attributable to the unique sector mix. In that case the coefficient would be equal to 1 if we had an exact sector-mix variable. The sign of the dollar coefficient accords with the hypothesis. As in the analysis with annual data, the intercept is insignificant. The adjusted R2 is 0.10.
We then split the sample into the two ten year subperiods. Panel C in table 4 shows the results for the period 1983-1992. As for the entire sample, only the sector-mix variable is significant. The sign for the dollar is the opposite of what we would expect. R2 remains low.
Panel D gives the results for the 1993-2002 sub-period. Here the sector mix, the dollar and the market all stand out as highly significant variables and R2 increases to 0.43. The regression coefficient for the dollar is -0.76. A 1% rise in the euro-dollar exchange rate results in a 0.76% underperformance for the AEX. Moreover, the AEX appears to have had an above-average beta of 1.37, as a 1% rise in the world index yields an outperformance of 0.37%. At 2.12, the coefficient for the sector mix is again clearly greater than 1.
These results support hypotheses H2a and H2b, which suggested that the relative performance was positively correlated to the sector mix and that this correlation would be higher in the latter part of the sample. In the first part of the sample the sector-mix coefficient is 1.37 with a p-value of 0.12 and a correlation coefficient of 0.25. In the second part of the subsample the significance increases to a p-value of 0.00 with a coefficient of 2.12 and a correlation of 0.45. Our results therefore do indeed suggest that the importance of sectors has been increasing over time. For the sample as a whole we find no significant relationship between the relative performance of the AEX and the dollar. We therefore have to reject hypothesis H3a. However, we do find evidence to support H3b, an increased sensitivity to dollar movements, in the latter part of our sample. In the second sub-period the dollar coefficient is -0.76 with a pvalue of 0.00.
We have to reject hypothesis H4 on the basis of the regression results. Changes in the bond yield do not affect the relative performance of the AEX. We do find indications that the relatively good returns for the AEX in the nineties were partly attributable to a higher market beta. In the second part of our sample the MSCI World Index in euros appears to be a significant variable. Our results suggest that the AEX had a beta of 1.37 during the period 1993-2002.
Finally, we had no quarterly data for institutional money flows. The results from the annual data were insignificant for this variable. However, the analysis based on annual data revealed no significant relationship between the relative performance of the AEX and any of the other variables either, so because of a lack of data we are unable to make a well-founded judgment about the role of institutional money flows. Based on observation of events in 1999, however, we think this factor does in fact play a role. In 1999 institutional investors sold an amount representing 4.8% of the total market capitalization of the AEX, which coincided with a 14% underperformance by the AEX. In the same year, the dollar factor and the market factor canceled each other out. The three factors identified in the quarterly regression analysis help us to explain 43% of the total variance in the relative performance of the AEX in the period 1993-2002 as indicated by R2. In the first subsample these variables have hardly any explanatory power; the adjusted R2 equals 0.04.
The sector mix has a positive attribution to the AEX of 34%, which is the cumulative log return of this variable for the 20-year sample period (41% normal return). That is more than half of the log outperformance of the AEX, equal to a cumulative 56% (74%). The cumulative effect of the dollar and market exposure is harder to estimate. These variables appear to be insignificant throughout the whole period. Moreover, to calculate the cumulative effect we would need an exact coefficient, unlike the sector mix for which we simply used the variable itself to extract a cumulative effect.
 In the exceptionally good 11 (calendar) years from 1988 to 1998 the AEX realized a cumulative log outperformance of 84% (132%). The sector mix only explained 12% (12%) of the fabulous return during this period. Moreover, the euro-dollar exchange rate barely changed. So, other than noticing that the AEX had an above-average beta, an important part of the outperformance during this specific period remains unexplained. As we mentioned before, we think that institutional money flows played a role. It is also possible that Dutch retail investors, encouraged by the relatively good performance of the Dutch economy, became more enthusiastic about stocks than investors in other countries; in other words, the equity cult grew relatively rapidly. Given the natural home bias of investors, see French and Poterba (1991), Dutch stocks may have benefited. Moreover, the relatively good performance of the Dutch economy yielded extra cash for the private sector.
In the next section we will discuss the change in relative valuation and underlying fundamental performance. The relative performance of the Dutch stock market is by definition equal to change in relative valuation and/or a change in fundamental performance relative to other countries, which may be reflected in relative earnings growth.
Valuation and fundamental performance
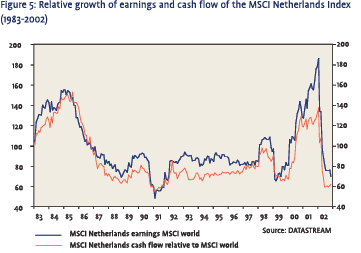 By contrast to the research discussed above, in this section we will use aggregate fundamental data for the MSCI Netherlands Index since these data are not available for the AEX. As is apparent from figure 4, the valuation of the Dutch stock market relative to the MSCI World Index approximately doubled between 1983 and 2002. Until 1990 the valuation of the Dutch market, measured by either price-to-earnings ratio or price-to-cash flow ratio, was around half of the market’s valuation, but by the end of 2002 its valuation was roughly in line with the market. In other words, this valuation graph suggests that, other things being equal, the Dutch stock market outperformed the MSCI World Index by approximately 110% (and based on price-to-cash flow ratio even by close to 120%).
Figure 5 shows the development of earnings and cash flow for the MSCI Netherlands Index relative to the MSCI World Index. Like the valuation chart, this graph is rather volatile. We see the reverse of the spike at the end of the valuation graph. In the last year, the fundamentals for the Dutch stock market, i.e. earnings and cash flow, lagged the world index5. This means that in 2002 the Dutch stock market was expensive in historical terms. Although there is absolutely no discernible trend in figure 5, it shows that earnings and cash flow underperform by approximately 30% to 40%. Taking the valuation and the fundamental performance together, therefore, the Dutch market should have outperformed by approximately 80%. This corresponds with the outperformance of the AEX as illustrated in figure 1, as well as that of the MSCI Netherlands Index.
Summary and Conclusions
The Amsterdam Exchanges Index (AEX), the main index of Euronext Amsterdam, outperformed the MSCI World Index by 165% in the period from December 1987 to August 1998, more than any country constituent in the MSCI World Index. However, coinciding remarkably neatly with the introduction of the euro, the outperformance abruptly came to an end in 1999. The AEX lagged the MSCI World Index by 14% in 1999 and subsequently displayed a slight underperformance.
We have analyzed five factors that might have played a role in the relative performance of the AEX since 1983. First, the net money flows of Dutch institutional investors, i.e. pension funds and insurers, into or out of domestic shares. The reason for taking this factor into account is that Dutch pension provisions are the highest in the world. The home bias in equity portfolios of institutional investors and changes in their preference for domestic shares might have affected the AEX in relative terms. The next factor that could cause deviations from the world index is the specific sector mix of the AEX. Finally, we checked whether sensitivities to changes in the dollar exchange rate, the bond yield and the world stock markets are able to explain the relative performance.
All regression analyses based on annual data produce insignificant results. With quarterly data the sector mix becomes a significant variable during the whole sample period from 1983 to 2002. R2 equals 0.10. In the first ten-year sub-sample period the sector mix is also the only significant variable. The explanatory power is low with a R2 of 0.04. In the second sub-sample from 1993 to 2002 the sector mix, the dollar and the market all become highly significant, while R2 jumps to 0.43. Our results suggest that the importance of the sector mix has increased. We do not find any evidence that movements in the bond yield plays a role in the relative performance of the AEX.
We have no quarterly data available for institutional money flows. We are therefore unable to make a well-founded judgment about the role of institutional investors. However, based on the 14% underperformance of the AEX in 1999, when Dutch institutional investors sold domestic stocks amounting to 4.8% of the market capitalization of the AEX, we think the investment policy of pension funds and insurers may in fact have played a role.
To conclude, to estimate the relative performance of the AEX investors should consider the sector mix of the AEX, their view on the dollar and the general market climate, and moves by institutional investors.
Literature
- Blitz, David C., Angelien G.Z. Kemna, Ruben Mikkers and Judit J.W. Vennix, 2000, De Globalisering van Aandelenmarkten (The Globalization of Stock Markets), Economische en Statistische Berichten (ESB, Economic and Statistical Bulletin), vol. 85, no. 4250, 280-283.
- De Nederlandsche Bank (Dutch central bank), March 2003, Statistisch Bulletin (Statistical Bulletin).
- Doeswijk, Ronald Q., 2005, The Index Revision Party, Review of Financial Analysis (forthcoming), vol. 14, no. 2.
- French, Kenneth and James Poterba, 1991, Investor Diversification and International Equity Markets, American Economic Review, vol. 81, no. 2, 222-226.
Noten
- From 1994 onwards the capped market capitalization determined a stock’s index weight. In October 1989 10 stocks were given a base weight of 5% and 15 stocks were given a base weight of 3.33%. Before 1989 the index was practically equally weighted and contained less than 25 stocks. In 1983 the index started with 13 index members.
- There are no total return data available for the aggregate AEX index. Therefore, we use price returns. Consequently, we probably underestimate the relative performance of the AEX because dividend yields are above average in the Netherlands.
- During 1999 and 2000 Dutch companies invested billions of dollars in the United States. The top five transactions in these two years are as follows. Unilever bought Bestfoods for USD 23 bln, Aegon bought TransAmerica for USD 11 bln, ING bought Reliastar for USD 5 bln, Ahold bought U.S. Foodservice for USD 3 bln and ABN Amro bought Michigan National for USD 3 bln.
- Before 2001 the annual index revision took place at the close of the third Friday in February. Apart from the annual revision, there are sometimes marginal adjustments due to mergers or bankruptcies. Euronext Amsterdam does not add new stocks to the index during the year, except for merged stocks, but reallocates the weight to the remaining stocks when the situation arises. Before 1994 there were infrequent index changes.
- Philips reported a loss of EUR 2.6 bln during 2001 (2000: EUR +9.8 bln), KPN a net loss of EUR -7.5 bln and ASML lost EUR 479 mln. These are significant amounts. For comparison we mention the EUR 7.3 bln earnings of Royal Dutch, the largest stock on the Dutch stock market.
in VBA Journaal door Ronald Doeswijk