
Introduction
 The investment strategies pursued by pension schemes are changing. During the past decade, we have moved away from peer group comparisons to scheme specific benchmarks based on market indices. Now we are seeing a shift towards ‘liability driven’ strategies. This is not a new era; it is simply an ongoing evolution with each successive shift in investment philosophy exhibiting a common thread – the tightening of the link between assets and liabilities.
But what exactly are liability driven strategies?
A liability driven solution is an investment strategy that has, at its core, a ‘transparent linkage’ between pension fund assets and liabilities. Whilst pension funds have always invested assets to meet their liabilities – that is their primary purpose – this transparent linkage has hitherto been elusive.
No single catalyst is behind the shift toward liability driven strategies. We have witnessed a raft of regulatory changes, falling investment markets, declining funding levels and a reduced expectation of the equity risk premium. Coupled with this, advances in corporate finance have expanded the investment opportunities for pension funds. Each of these has contributed to a fundamental re-examination of contemporary pension fund investment strategy.
The key: understanding the liabilities
A pension fund’s liabilities are the benefits paid to scheme members and consists of a series of cash flows that the scheme must pay out in the future. The cash flows are usually calculated by an actuary and are based upon the aggregate forecast of all the benefits for the members. Typically, the expected cash flows are based on the accumulated benefits to date for existing members and will not take account of future joiners – this future liability should be covered by sponsor and employee future premiums.
Pension fund liabilities are long-dated. Their calculation involves forecasting far into the future (70 years or more) to estimate what payments will be made, as well as the value that these distant payments should have today.
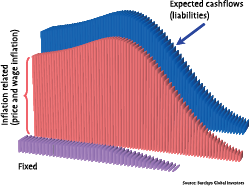
A typical aggregate cash flow profile is shown in the figure below.

As can be seen, the expected cash flows rise steadily from current levels before falling away more sharply in later years.
Aggregate pension liabilities can also be split into index-linked and fixed benefits. A fixed pension is where a pensioner receives a proportion of final salary at retirement with no future increases. An indexlinked pension delivers annual increases linked to inflation and these benefits represent the majority of pension fund liabilities for many schemes, as shown below.
What factors impact the value of the liabilities?
There is a distinction between the factors that impact the level of the promised pension payments in the future (the estimated future annual cash flows), and what we estimate as the value of these future payments in today’s money.
The future payments made to beneficiaries rise as a result of longevity increases, discretionary awards, service and inflation. The current market value of these aggregate payments is sensitive to changes in the discount (interest) rates. The current market value of the future payments increases when rates fall, and vice versa, in a similar way to movements in the value of bonds.
How volatile are the liabilities?
The future benefits (annual cash flows) include a degree of uncertainty as a result of a number of factors including the incidence of early retirement and improvements in mortality. Such factors cause estimation errors. But it is changes in the market interest rates that give rise to the significant volatility of the cost of providing these benefits.
Historically, the volatility of liabilities was masked as only triennial valuation snapshots were available. Advances in modelling technology have shown that the volatility of the liabilities is as high, and often higher, than a diversified portfolio of assets.
The long-term nature of the liabilities magnifies their volatility. Small changes in inflation or interest rates have a significant impact when applied over such a long-term horizon. This is similar to a 30-year bond being more sensitive to interest rate changes than a 10-year bond.
Pension Fund Investment objectives
A brief history
Investment objectives have long been the cornerstone of pension fund investment – they define what is expected, in performance terms, of the pension fund assets and the associated investment managers. But investment objectives were also a key contributor to the erosion of funding levels over recent years.
When trustees set their pension fund investment objectives they are intrinsically translating expectations of the liabilities into investment targets for the assets.
Peer group benchmarks were the most common investment objective up to and including the first half of the 1990s. Trustees set their investment managers the objective of beating the peer group average. Balanced managers were often employed to run portfolios including domestic and overseas equities, bonds and property.
Traditional peer group balanced management had three problems. First, it failed to reflect the specific liabilities of pension schemes. Secondly, it assumed fund managers could do everything well. Thirdly, at any one time, only half the pension funds, by definition, could outperform the peer group average.
What was happening to the liabilities during this time was generally not given as much attention as the performance of the assets. Equity markets had delivered a decade of strong returns and the buzz words were ‘surplus’ and ‘premium holidays’. But that was about to change.
The mid-1990s saw the adoption of scheme specific benchmarks, in conjunction with specialist management, to address the flaws in the peer group approach. Trustees now set their strategic asset allocation with regard to their own liabilities, often on the back of an asset liability study, before seeking to appoint a range of fund managers regarded as specialists in various asset classes.
Even this approach had its drawbacks. Investment objectives were framed in terms of market indices, without any explicit reference to the liabilities, partly because this was what investment managers preferred. This left trustees with the difficult role of translating expectations about movements in the liabilities into expectations about the outperformance of individual asset classes.
The specialist approach and its derivatives (for example, core/satellite) ran into trouble as funding levels plummeted to low levels. A key problem, once again, was the investment objective.
Liability Driven Investment Objectives
The underlying desire of the trustees in setting investment objectives is to outperform their liabilities by a certain level each year. However, given the limited information on the nature of liabilities available historically, naturally the focus fell more on the assets resulting in a significant and often unappreciated mismatch with the liabilities.
Today the tools are available for a very close translation of expectations allowing trustees to define the investment objectives explicitly in terms of the liabilities. For example, a liability driven investment objective might be of the form: match the change in liabilities plus outperformance of x% p.a.
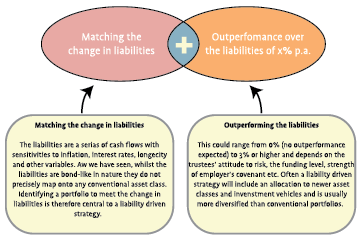 Here, the change in the liabilities covers the service charge (interest accrual due to the passage of time) and changes in variables that can be hedged such as interest rates and inflation. The outperformance target is set in terms of the liabilities.
The linkage is transparent and explicit – the assets should outperform the liabilities by x% each year. The liability investment objective focuses on the liabilities first and then addresses the desired level of outperformance over the liabilities, subject to various risk constraints.
The liability driven investment objective should be viewed as a refinement of existing investment objectives rather than a completely new approach. Existing investment objectives, which usually consist of a summation of exposures to various asset classes, can be translated to an expectation of performance relative to liabilities.
Liability driven investment: a four step process
Liability driven investment solutions offer trustees the opportunity to structure their investments so that performance relative to liabilities is the primary measure of investment success. Investments can take advantage of evolutions in the financial markets, whereby many pension fund risks can now be efficiently hedged and investment manager skill can be accessed in a variety of ways.
Step 1: Minimum risk liability matching portfolio
The foundation for any liability driven strategy is the cash flow forecasts. This will estimate year-by-year cash flows as well as the proportion of these cash flows that is sensitive to inflation including the any inflation caps and floors.
This forecast facilitates the identification of the minimum risk liability matching portfolio, or least risk portfolio, which is a combination of assets exhibiting similar sensitivities to interest rates, inflation and other variables as the liabilities. Using fixed bonds and inflation-linked bonds, a pension scheme can construct a low risk cash flow matching portfolio with the objective of producing the required cash flow at the time it is needed. In other words, the asset cash flows will be approximately equal and synchronized with the liability cash flows.
 The problem with just using government bonds is the limited range of securities available. Any match using government fixed income and inflation-linked securities will inevitably be ‘lumpy’ and will not extend far enough into the future to cover all the liabilities. Matching can be made more accurate by including other assets, such as supra-national and corporate bonds.
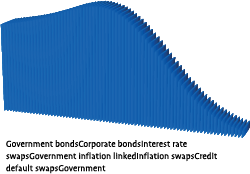
Swaps might also be used to fine tune the exposure, or alternatively, it is possible to construct a predominantly swaps based solution using interest rate swaps, inflation swaps and credit default swaps to achieve the same bond exposures as a conventional portfolio. This ‘synthetic’ solution usually offers greater flexibility than the physical approach.
Typically a liability matching portfolio will include the asset classes shown in the figure below.
The minimum risk liability matching portfolio should be considered the reference point from which to frame the strategy.
Step 2: Risk budget and return portfolio policy benchmark
The next step for trustees is to perform a risk budgeting exercise. This will determine the overall risk constraints of the portfolio, the aggregate target outperformance and how much of this will come from market exposure and how much from active management. For example a target of 2% outperformance over liabilities might be adopted with 1% coming from market exposure (beta) and 1% from active management (alpha).
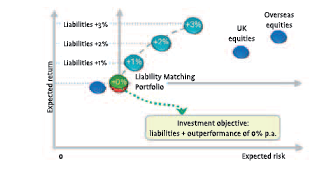
Setting the asset allocation benchmark for the pension scheme is similar in the liability driven arena to traditional methods, the principal difference being the liability matching portfolio is treated as if it were an asset class and there is a specific allocation towards it.
The figure below shows that if we were targeting 1% outperformance (from market exposure only at this stage) we might allocate just over half of our assets to the liability matching portfolio and the remainder to equities and other assets.
 It is necessary to differentiate between market (beta) return and active manager (alpha) return. Beta return or risk premium (equity, property, credit, commodity) is an unconditional return that is the reward for accepting market risk and an investor can access cheaply via index funds and derivatives. Alpha return is conditional on active manager skill, is expensive and requires much monitoring. Historically pension funds have allocated ~85% of their risk budget to market risk exhibiting a higher risk aversion to active risk.
Theoretically, it is possible to allocate between beta and alpha in one step through defining a risk aversion factor for each source of return, however, in practice, the loss of efficiency in the described two step process is low.
Allocating assets away from the minimum risk portfolio to the return portfolio would alter the composition of the minimum risk portfolio if the investor is not able to implement unfunded overlays. Unfunded or partially funded overlays allow the investor to create a return portfolio while still keeping in place a minimum risk liability profile using a swaps overlay. In effect, the investor decomposes the pension scheme risks choosing to hedge uncompensated risk (interest rate and inflation) while allocating their risk budget to compensated risks (asset class risk premium, active manager).
Step 3: Active manager outperformance
 The third step is to consider active manager outperformance. Our asset universe should be quite comprehensive and may include traditional ‘long-only’ strategies that combine manager outperformance and market exposure as well as pure outperformance vehicles. Absolute return funds (for example hedge funds, asset allocation funds and currency funds) which target pure outperformance have a natural fit in this context.
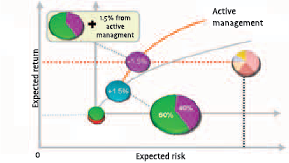
The figure below shows there is a spectrum of choice with regard to manager outperformance and also indicates that seeking outperformance from active management does not increase the overall risk levels as much as seeking outperformance from market exposure (note the curve is steeper).
An aggregate 2% out-performance portfolio might include the following weightings: 55% government and corporate bonds, 25% active domestic and international equity, 10% property, 5% hedge funds and 5% commodities. This could be implemented entirely with physical instruments and pooled funds.
Step 4: Implementation
Implementing liability driven solutions will probably mean a shift in the asset allocation of a pension scheme and the possibility of accessing newer types of investment vehicles. There are many issues to consider in undertaking these changes, from size constraints to transition approaches to timing, and this article does not seek to address these.
Concluding comments
The four-step process presented here is a simplified procedure capturing the main themes of liability driven investment. However, applied in an iterative manner, they offer pension schemes a framework to assess their liability characteristics, how much risk they are running against liabilities today, help them decide what risk levels they want to run with, explicitly define an excess return objective and build a return portfolio with maximum diversification.
There are manifold ways to frame liability driven investment solutions, some of which vary considerably from that discussed. However, any liability driven approach should have an overriding theme of structuring the assets such that there is a transparent linkage to the liabilities.
Pragmatism must also be at the heart of any liability driven strategy. Not all of the variables affecting a pension scheme can be addressed effectively from an investment perspective (e.g. longevity) and whilst high levels of accuracy versus the current expected liabilities may be achievable, it may be spurious due to these factors.
in VBA Journaal door Tarik BenSaud, Marko van Bergen