
In this study, we examine the Dutch mergers and acquisitions market for the ten-year period 1997-2006. This study only includes cases where the target company was quoted on the Dutch stock exchange. On average in the 20 days before the announcement of a takeover, targets outperform the market by 5.4%, while on the day of the announcement the stock enjoys an additional premium of 14.7%, resulting in a compounded total premium of 20.9%. The total premium for mergers is 5.8% and for acquirers -1.8%. In the two years following the day of the announcement, the eleven mergers in our sample show an average annual underperformance of 7.5% after correcting for bèta, size, and the value factor.
 Introduction
The mergers and acquisitions market has attracted considerable academic attention. For the short term, results are rather unambiguous. Targets benefit from the announcement of a deal, while for acquirers and mergers there is no clear pattern. For the long term, it is hard to isolate the effect related to M&A activity. However, despite the inherent noise, mergers tend to exhibit negative long-term abnormal stock performance.
In this study, we examine the Dutch mergers and acquisitions market for the ten-year period 1997- 2006. The main criterion for inclusion in the sample is that the target was listed on the Dutch stock exchange. Takeovers of foreign companies by Dutch firms were excluded from the sample. On average in the 20 days before the announcement of a takeover, targets outperform the market by approximately 5.4%, while on the day of the announcement the stock enjoys an additional premium of 14.7%, resulting in a compounded total premium of 20.9%. The total premium for mergers is 5.8% and for acquirers -1.8%. In the two years following the day of the announcement, the eleven mergers in our sample show an average annual underperformance of 7.5% after correcting for bèta, size, and the value factor.
In the next section we provide an overview of the academic literature on this subject. Subsequently, we discuss the data and methodology that we use in this study. Then, we present our empirical results. We make both a short-term and a long-term study. For our long-term analysis, we focus on mergers, as international academic research has repeatedly shown that merging companies underperform. We conclude with a summary and our main conclusions.
Literature review
Most academic research on mergers and acquisitions (M&A) focuses on three characteristics. M&A activity exhibits wave patterns over time, M&A activity tends to be concentrated in specific sectors and mergers show on average a long-term underperformance. Over the years, a large quantity of academic literature has been devoted to this topic. There are three distinctive specific schools of thought. The neoclassical view holds that merger waves are an efficient response to regime shifts by value-maximizing shareholders. Mitchell and Mulherin (1996) provide evidence that the merger wave of the eighties was concentrated largely in sectors that were exposed to deregulation, increased foreign competition, financial innovation and external price shocks, such as oil price rises. Andrade, Mitchell and Stafford (2001) show that during the nineties deregulation in the financial, utilities and telecom sectors was the driving force, accounting for nearly half of all M&A activity. The neoclassical school, thus, explains why M&A activity occurs in specific sectors and exhibits a wave pattern over time. However, the neoclassical school presents no explanation for the fact that the stocks of companies that merge display long-term underperformance.
The behavioral view argues that market inefficiencies drive M&A activity. In other words, when the market value of a company’s stock deviates significantly from its fundamental value, management has a strong incentive to exploit this market inefficiency, see Shleifer and Vishny (2003). One can rationalize this in two ways. On the one hand, a company that is overvalued will try to exploit this situation by acquiring another company and by paying in equity. In fact, Rhodes-Kropf, Robinson, and Viswanathan (2004) find that the chance of an acquisition being equity financed increases with the relative valuation of the acquirer. On average, acquirers exhibit a 20 percent higher market-to-book ratio than targets. The payment method acts as a signal and explains why the acquiring company’s stock price reacts negatively in response to the takeover announcement. On the other hand, undervalued companies are attractive takeover targets, especially if the transaction is financed with cash. In this way, current shareholders profit from the target’s undervaluation. Interestingly Rhodes-Kropf, Robinson, and Viswanathan (2005) show that targets in cash takeovers are usually undervalued.
A third theory on M&A activity argues that mergers and merger waves occur because the management of a company prefers independence to being acquired, see Gorton, Kahl, and Rosen (2005). This preference can result in to two different scenarios. In the best case, value-maximizing management will voluntarily agree with a takeover offer if the conditions are favorable and will not engage in defensive takeover strategies if this is not clearly in the best interest of the company’s shareholders. In this case both acquirers and targets exhibit positive stock-price reactions when they announce the deal. However, in the second ‘eat or be eaten’ scenario, managerial actions are dominated by a desire to remain independent, whatever the price. This means that management will keep an eye out for the actions of their competitors, which leads to herding behavior and consequently causes merger waves. The ‘eat or be eaten’ theory explains the negative long-term performance of merging companies, but also gives a good explanation for the clustering of merger activity in specific sectors.
When examining the relative stock-price performance of mergers and acquisitions, it is important to make a clear distinction between the abnormal return around the announcement date and the long-term abnormal returns. Virtually all academic research has shown that the short-term returns for takeover targets are abnormal after the announcement of the deal. This makes perfect sense as acquirers generally offer an attractive premium over the current stock price. The short-term abnormal returns for acquirers, however, differ quite substantially from study to study, so it is difficult to derive any general conclusion. There is also a lack of consensus in academic literature as to the short-term performance of companies that merge.
Studies that have focused on the long-term performance of mergers and acquisitions also present a mixed picture. This is hardly surprising as it is hard to isolate the effects relating to M&A activity in the long run. In other words, after a while, news that is unrelated to the merger will also impact the stock price. However, for merging companies results indicate underperformance despite the inherent noise in the estimation process, see Agrawal and Jaffe (2000). This disappointing long-term performance for mergers suggests a structural overestimation of the synergetic effects. In addition, the negative performance of merging companies is stronger when the merger is equity financed. This finding is in line with research on the short-term abnormal returns of equity-based M&A.
In recent years, academics have shifted their attention to the dynamics of merger waves. One conclusion that appears repeatedly in academic papers is that mergers and acquisitions closer to the final phase of wave, exhibit patterns consistent with herding behavior. In other words, a shock in a certain industry’s environment can motivate management to react resulting in a large-scale reallocation of assets. However, due to this herding behavior, companies can continue to take such action after the optimal period for doing so is over and this will result in lower abnormal returns surrounding the announcement date and disappointing long-term returns, see Harford (2004).
To summarize, mergers and acquisitions are driven by structural change within a specific sector, misvaluation and the defensive motives of the management. The shareholders of takeover targets are the main beneficiaries around the announcement date, while the picture for acquirers and/or mergers is less clear. Earlier research suggests that companies that merge disappoint in relative terms in the years following the merger announcement. Bearing this in mind, we now turn our attention to the mergers and acquisitions that have taken place in the Dutch stock market during the last ten years.
 Data and methodology
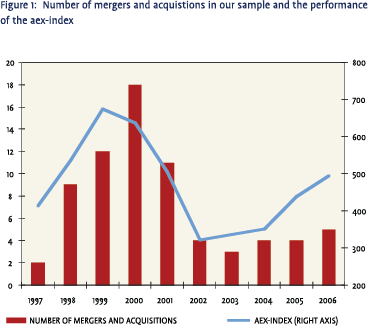
In this study, we focus on all the mergers and acquisitions that have taken place in the Dutch stock market in a ten-year period from 1997 until the end of 2006. We exclude takeovers of foreign companies by Dutch firms. In total, our sample consists of 72 transactions, 18 of which involved one non-listed party. All transaction data was generated from Bloomberg. Figure 1 shows the distribution of all transactions during the specified ten-year period. It shows a clear correlation between the number of transactions and the general conditions on the stock market. Rising stock prices go hand-in-hand with an increase in the number of mergers and acquisitions and vice versa.
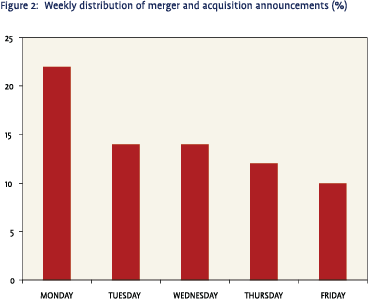
As Figure 2 clearly shows, Monday is the day most mergers and acquisitions are announced. In our dataset, 22 out of the 72 transactions, or around 30%, were announced on a Monday. This is less than the 47% figure published by Doeswijk and Hemmes (2001) in an earlier study. Monday is a popular announcement day because deals are often finalized at the weekend when the financial markets are closed.
In this study, we make a distinction between short and long-term stock performance. For our shortterm analysis, we compare the stock-price performance to that of the Dutch AEX-index2 for a period of 20 days before and 20 days after the announcement date. The total time frame is thus 41 days. We do not correct for risk factors because of the relatively short time frame before and after the announcement. A short-term analysis does not require a risk correction because any abnormal returns should be great enough to outweigh the marginal effects of a risk correction.
 For the long-term analysis, we examine the relative performance for a two-year period starting at the close of the announcement day. We focus on mergers, where we define a merger as a transaction in which no party is twice as big as the other party involved. In other words, we select transactions where the market value of the parties involved does not differ by more than a factor two. We are interested in the long-term performance because international research has repeatedly shown that companies that merge show disappointing returns in the period following the merger announcement. Our sample consists of eleven mergers. This dataset is too small to attach any statistical significance to our findings, but it can provide an indication or a confirmation of a broader pattern.
The long-term study considers relative performance, but also corrects for risk factors using the three-factor model created by Fama and French (1993). We use the Fama and French model because it is widely recognized by academics and financial professionals alike and uses common risk factors to clean stock returns for bèta, smallcap, and value effects. In other words, the Fama and French model gives an approximation of alpha or abnormal returns. Bèta represents the sensitivity of a stock to the market. We do not use the extended Fama and French model as suggested by Carhart (1997) as we do not have a readily available momentum factor.
The value and size factors are both determined at European level because these are not available for the Netherlands alone. We base the value factor on the relative performance of value versus growth stocks for which we use Standard & Poor’s total return indices. We base the size factor on the relative performance of smallcaps versus largecaps. Here, we use largecap data from MSCI and smallcap data from HSBC. From 2002 onwards we have total return indices available for smallcaps. Before this date, we use the price return difference. The reinvested AEX-index represents the market factor, while we use the one month AIBOR as the risk-free rate.
The source for our return, smallcap and value data used in this study is Thomson Financial Datastream.
Empirical results
Short-term analysis
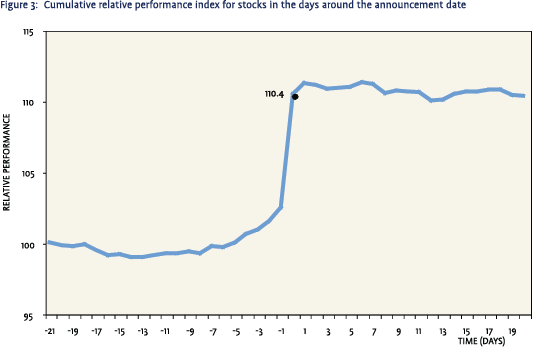
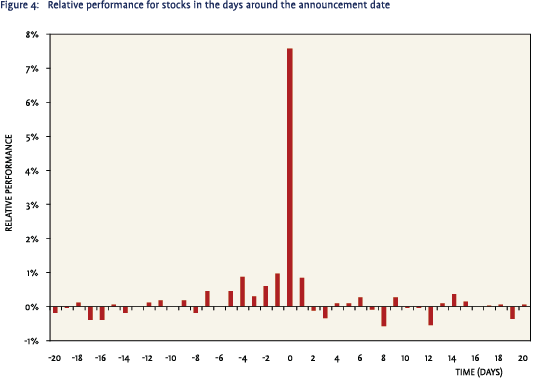
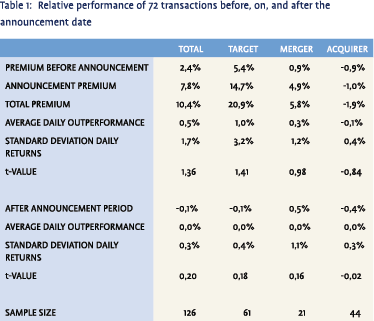 As Figures 3 and 4 show, companies involved in a merger or acquisition perform better on average than the AEX index. This outperformance amounts to 10.4% for the period of 21 days ending on the announcement date. Our study shows that these results can be subdivided into a 7.8% takeover premium and a 2.4% run-up in the 20 days before the announcement, see Table 1. In 65% of all cases, the stock outperforms the benchmark in the 21 days leading up to and including the announcement date. The t-statistic of the total premium is too low to claim any statistical significance, but this is due to the limited size of our sample since the results are fully in line with previous international academic research. Moreover, the t-statistics for the days -2, -1 and 0 are significant (not reported separately in Table 1).
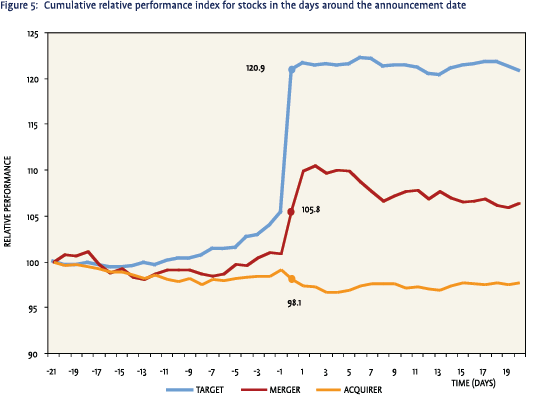
If we separate the results for targets, mergers, and acquirers, we find that targets, not surprisingly, experience the largest announcement-date change in their share price. Figure 5 shows the relative performance. Before the announcement, the cumulative abnormal return, on average, is already 5.4%, and the announcement premium is 14.7%. This amounts to a compounded total premium of 20.9% in the 21-day period up to and including the announcement date. Acquirers show an average underperformance of 1.9% in this same 21-day period. Companies that merge show abnormal returns that are somewhere in between, at 5.8%. After the news of a merger or acquisition becomes public, all categories, acquirer, target, and companies that are merging, perform broadly in line with the market.
 Share prices of companies involved in a merger usually show a run-up in the period leading up to the announcement. For all companies, the run-up in the month before the announcement is 2.4% and the announcement premium is 7.8%, as shown in Table 1. The run-up is important, because it causes acquirers to pay more and thereby erodes the value for their own shareholders, see for example Schwert (1996). There are several explanations for this run-up. First, market rumors of a potential deal can push up prices. We estimate that this is most frequently the case, especially because there is a sectoral clustering of deals, as Mitchell and Mulherin (1996) report. They find that, in general, 50% of the mergers and acquisitions in a given industry are clustered within a two-year period. Therefore, investors may start to anticipate potential deals once a consolidation trend is under way in a certain sector. Second, companies sometimes announce that they are talking to another unspecified party about a merger or acquisition. In other cases, information leaks out during the negotiations that occur prior to the announcement. This normally causes investors to react. Third, publicly available information could indicate a potential acquisition. Dutch legislation requires companies that hold more than a 5% stake in another company to disclose the fact. Fourth, when the bid is announced, a rival bid may emerge that has been driven up by the first bid. Finally, insiders could have used the information they possess to profit from the upcoming announcement. In terms of the US market, this theory is supported by the findings of Barclay and Warner (1993). When looking at trading patterns during the 30 days before the announcement, they find that most of the pre-bid run-up in the price occurred through medium-sized trades (500-9900 shares). Insiders dislike large trades because these are easier to detect. They prefer to spread their trades across different accounts and different brokers. To conclude, the run-up of prices before an announcement does not point to an inefficient market, but can be explained by the abovementioned factors.
 Long-term analysis
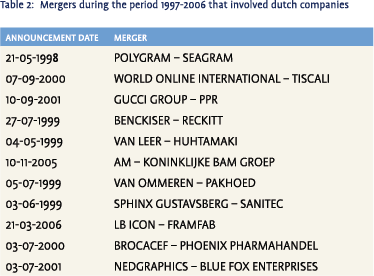
For our long-term analysis we focus on mergers, as international academic research has repeatedly shown that merging companies underperform. We examine the eleven mergers that have taken place in our sample. The mergers we use are listed in Table 2. On average, our sample also exhibits underperformance, which is strongest during the six months immediately following the announcement as shown in Figure 6.
Our regression analysis on daily returns over a twoyear time period gives the following results (t-values shown in brackets):
R = -0,075 + 0,7 Market + 0,0 Value + 0,50 Size + e
Where:
- R is the average return of the merged company The constant represents alpha and equals 7,5% on an annualized basis
- Market is the market factor
- Value is the value versus growth factor
- Size is the smallcap versus largecap factor
- e is the error term
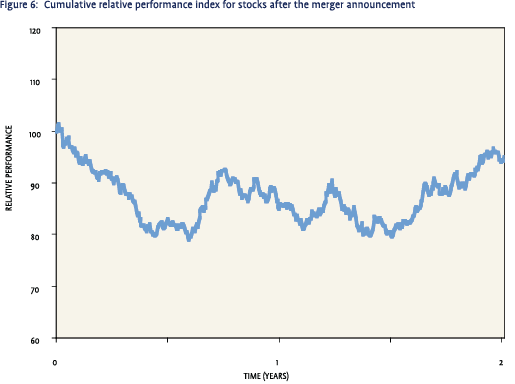 Our results show a negative alpha for seven of the eleven mergers in our sample. On average, alpha is -7.5% on an annualized basis for the two years immediately following the merger announcement. Despite our relatively small sample size, this result is in line with other studies on mergers. The underperformance we found does, however, seem to be on the high side. As is repeatedly shown, mergers underperform the broader market by an average of 10-15% in the first five years after the announcement. We reemphasize that equity-financed mergers have a greater chance of underperforming than those financed with cash.
Summary and conclusions
This study focuses on all the mergers and acquisitions in the Dutch stock market in the ten-year period from 1997 until the end of 2006, for which the target company was quoted on the Dutch stock exchange. We have excluded takeovers of foreign companies by Dutch firms. In total, our sample consists of 72 transactions, 18 of which involved one non-listed party.
Monday appears to be the preferred day for announcing a merger or acquisition. In our dataset, 22 out of the 72 transactions, or around 30%, were announced on a Monday. Monday is popular because deals are often finalized at the weekend when the financial markets are closed and when rumors or information leaks cannot influence the stock price.
In our short-term analysis, we examine the performance in the 20 days before and 20 days after the announcement date. If we separate the results for targets, mergers, and acquirers, we find that targets, not surprisingly, show the largest announcement-date change in their share price. Before the announcement, the cumulative abnormal return, on average, is already 5.4%, and the announcement premium is 14.7%. This amounts to a compounded total premium of 20.9% in the 21-day period up to and including the announcement date. Acquirers show an average underperformance of 1.9% in this same 21-day period. Merging companies show abnormal returns that are somewhere in between, at 5.8%. Immediately after the news of a merger or acquisition has been made public, all categories, acquirer, target, and merging companies, perform broadly in line with the market.
For the long term, we examine the eleven mergers in our sample as international academic research has repeatedly shown a disappointing relative stock performance in the years after the merger announcement. After correcting for bèta, size, and value, we find a negative alpha for seven of the eleven mergers in our sample. On average, alpha is an annualized -7.5% for the two years following the merger announcement. The disappointing long-term performance for mergers suggests a structural overestimation of synergetic effects.
Our results for the Dutch stock market are broadly in line with previous studies for other markets. As an investor, it is particularly worth taking into account the long-term underperformance of mergers as this suggests that mergers tend to disappoint.
Noten
- The authors are grateful to the analysts of IRIS Research for their constructive comments. Next, we thank an anonymous referee for the useful suggestions.
- The AEX-index is the best benchmark available for this study. It is a capped market capitalization weighted index, in contrast to the uncapped market capitalization weighted MSCI Netherlands index which is more skewed towards a few large caps.
References
- Agrawal, Anup en Jeffrey Jaffe, 2000, The Post-Merger Performance Puzzle, in Advances in Mergers and Acquisitions, vol. 1, 7-41, Amsterdam: Elsevier Science.
- Andrade, Gregor, Mark Mitchell en Erik Stafford, 2001, New Evidence and Perspectives on Mergers, Journal of Economic Perspectives vol. 15, no. 2, 103-120.
- Barclay, Michael J., en Jerold B. Warner, 1993, Stealth Trading and Volatility: Which Trades Move Prices?, Journal of Financial Economics, vol. 34, no. 3, 281-305.
- Carhart, Mark M., 1997, On Persistence in Mutual Fund Performance, Journal of Finance, vol. 52, 57-82.
- Doeswijk, Ronald Q., en Hemmo S.K. Hemmes, 2001, Mergers and Acquisitions in a Global Context: Reaction of Price and Earnings Estimates, Journal of Investing, vol. 10, no. 2, 29-35.
- Fama, Eugene F., en Kenneth French, 1993, Common Risk Factors in the Returns on Stocks and Bonds, Journal of Financial Economics, vol. 33, no. 1, 3-56.
- Gorton, Gary, Matthias Kahl en Richard Rosen, 2005, Eat or be Eaten: A Theory of Mergers and Merger Waves, NBER Working Paper 11364.
- Harford, Jarrad, 2004, What Drives Merger Waves?, Journal of Financial Economics, vol. 77, no. 3, 529-560.
- Mitchell, Mark L., en J. Harold Mulherin, 1996, The Impact of Industry Shocks on Takeover and Restructuring Activity, Journal of Financial Economics, vol. 41, no. 2, 193-229.
- Rhodes-Kropf, Matthew, David T. Robinson en S. Viswanathan, 2005, Valuation Waves and Merger Activity: The Empirical Evidence, Journal of Financial Economics, vol. 77, no. 3, 561-603.
- Schwert, G.William, 1996, Markup Pricing in Mergers and Acquisitions, Journal of Financial Economics, vol. 41, no.2, 153-192.
- Shleifer, Andrei, en Robert W. Vishny, 2003, Stock Market Driven Acquisitions, Journal of Financial Economics, vol. 70, no. 3, 295-311.
in VBA Journaal door Ronald Doeswijk (l), Adriaan Floor (r)