
Introduction
 Many investment portfolios contain a portion of emerging market equities. Common reasons for investors to allocate to this asset class have been fourfold: 1) capture a potential risk premium, 2) diversify a traditional equity/bond portfolio, 3) get some commodity exposure and therefore inflation protection in the portfolio and 4) because it is simply part of the broader market portfolio, see Doeswijk et al. (2014) and Saunders and Walter (2002). The typical way to determine the weight of emerging markets in a broader portfolio is through historical analyses based on generic capitalizationweighted indices, such as the MSCI Emerging Markets Index. Although this index captures a potential general emerging market premium, it might underestimate the added value of the asset class. Numerous studies have shown the existence of other risk premiums in equity markets, such as the value and momentum premiums. These effects have been documented in developed equity markets by Fama and French (1992) and Jegadeesh and Titman (1993), among others, but also in emerging markets, by Rouwenhorst (1998, 1999), Van der Hart et al. (2003) and Van der Hart et al. (2005) for example. In addition, various studies have emphasized the added value of allocating to factor premiums, such as Ang et al. (2009), Bender et al. (2010), Ilmanen and Kizer (2012) and Blitz (2012). The main conclusion from these studies is that extending a portfolio which only consists of traditional market premiums with various other factor premiums significantly increases its risk-adjusted return. This is due to the relatively low correlations between these premiums, as well as to the higher Sharpe ratios of the factor premiums.
Inspired by these studies which often consider only developed equity markets (DM), the authors take a fresh look at the strategic allocation to emerging equities, considering not only the market portfolio, but also various other factor premiums documented in the emerging equity markets (EM). The first part of the study discusses the added value of allocating to the emerging equity market premium and shows a clear positive contribution to a traditional equity/bond portfolio from an historical perspective. In addition, a diversified portfolio of the value and momentum factor premiums in emerging markets exhibited a materially better risk-adjusted performance than the passive market capitalization weighted emerging markets portfolio. Consequently, allocating to these factor premiums added sizable value, also when the developed markets equity part of the portfolio is already allocated to factors. The conclusions do not materially change when transaction costs and fees are considered. The authors therefore recommend investors to allocate part of their portfolio to factor premiums in emerging equity markets.
Emerging versus developed markets equities
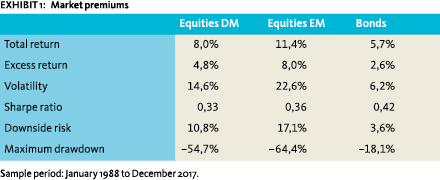 The first analysis presents the long-term return characteristics of market capitalization-weighted DM and EM equities and government bonds, based on well-known and frequently used indices. For developed markets equities the MSCI World total return index is used, and for emerging markets equities, the MSCI Emerging Markets total return index. In this study, these market capitalization weighted indices will be referred to as passive equities. For government bonds, the JP Morgan World Government Bond index is used.2 Exhibit 1 shows that from January 1988 (start of the MSCI Emerging Markets index) to December 2017, the excess returns of emerging markets have roughly been 65% higher than those of developed markets (over 3 percentage points). As expected, the volatility has also been substantially higher, around 1.5 times. This leads to a higher Sharpe ratio for EM equities. These results are in line with Bekaert and Harvey (2017), who also find higher returns, higher volatilities and higher Sharpe ratios for emerging markets compared to developed markets, over the period from 1988 to 2017. The bottom two rows in the table focus on tail risk, as measured by downside risk (standard deviation of the negative excess returns only) and maximum drawdown. The higher downside risk of emerging markets compared to developed markets is consistent with the higher volatility. However, the maximum drawdown is smaller than expected based on the volatility. Government bonds have performed very well over the sample period, with a Sharpe ratio of 0.42 compared to 0.33 for DM equities.
 Strategic allocation to emerging markets
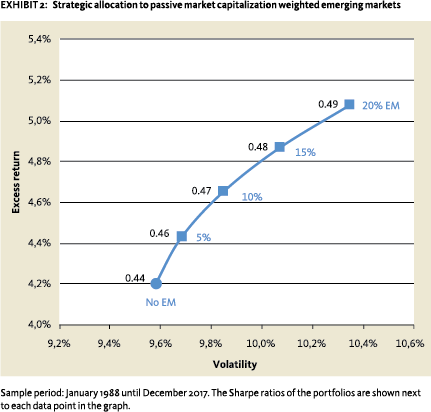
The next part of this analysis is on the added value of a strategic allocation to emerging markets. The assumed portfolio consists of a 60% allocation to developed markets equities and a 40% allocation to government bonds. Based on the historical return series and a monthly rebalancing frequency, this portfolio achieved an annual excess return of 4.2% with a volatility of 9.6%, over the 1988 to 2017 period. Next follows a range of portfolios where part of the equity portfolio is allocated to passive emerging markets equities. This allocation increases gradually by steps of 5%, up to 20%, at the expense of developed markets equities. The weight of government bonds remains the same. For example, the portfolio that allocates 20% to emerging markets, allocates 40% to developed markets equities and 40% to government bonds. Exhibit 2 shows the results.
The results show that allocating to emerging markets increased the risk-adjusted performance of a traditional equity/bond portfolio before costs. The volatility of the portfolio increases, but returns rise even more: from 4.2% excess return, when not allocating to emerging markets, to 5.1% excess return, when allocating 20% to emerging markets. This results in considerably higher Sharpe ratios, which increase from 0.44 to 0.49.
Allocating to factor premiums
Investors can not only allocate to the emerging market equity premium, but they also can allocate to other premiums, which are known to exist in the equity market. In this paper, the well-known momentum and value premiums are considered. These factors, for which there is abundant empirical evidence in the academic literature (see e.g. Van der Hart et al., 2003), help achieve higher returns. The value portfolio is built based on a combination of earnings-to-price ratio and dividend yield criteria. Meanwhile, the momentum portfolio relies on a combination of 12-1 month price momentum and earnings revisions over the latest 3 months. To be precise, the monthly return of the value portfolio is the equally-weighted return of the 33% most attractive stocks in terms of earnings-to-price ratio, assuming a 6-month holding period. The same applies for dividend yield and then, the two portfolio returns are equallyweighted. The momentum portfolio is constructed in a similar fashion.
 The top part of Exhibit 3 shows results for an emerging markets multi-factor quant portfolio consisting of a 50/50% allocation to these value (V) and momentum (M) factor premiums (V+M). This portfolio exhibits a materially better riskadjusted performance than a passive emerging markets portfolio. Specifically, the return of this portfolio was over 5% higher than the passive market portfolio with similar volatility. The downside risk and maximum drawdown were also somewhat lower for the factor portfolio in comparison to the market. The Sharpe ratio was around 65% higher than for the market index: 0.59 compared to 0.36 for the market index. These returns do not include management fees and transaction costs, which could have a large impact on performance. The impact of costs is investigated later on in this study.
Combining value and momentum factor premiums in emerging markets improved riskadjusted performance
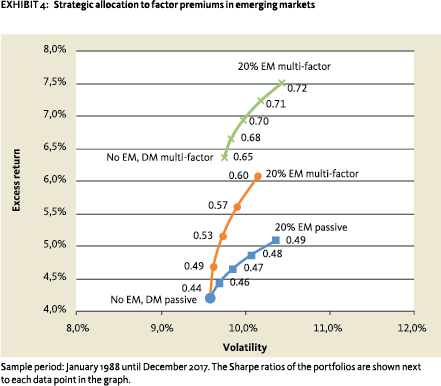
These results suggest that allocating to an emerging markets multi-factor portfolio adds even more value in the strategic asset allocation than allocating to the market portfolio only. The middle line with diamonds in Exhibit 4 shows an excess return enhancement from 4.2% to 6.1% with Sharpe ratios ranging from 0.44 to 0.60.
 For investors allocating to both emerging and developed markets, factor allocation may not necessarily be limited to the emerging markets. The bottom part of Exhibit 3 shows the historical factor premiums in developed equity markets. As in emerging markets, the value and momentum portfolio performed substantially better than the market, with an additional return of 3.8%. Investors may wonder whether, in this case there is still added value in allocating to emerging market factor premiums as well.
The top line in Exhibit 4 shows this effect. The 60% allocation to equities in the portfolio consists of a developed markets multi-factor portfolio with a 50/50% allocation to a value and momentum portfolio, constructed in a similar fashion as in emerging markets. This multi-factor portfolio represents already a sizable improvement compared to a passive market portfolio. It had a higher Sharpe ratio of 0.65, compared to 0.44 for the passive portfolio. These results are in line with Blitz (2012). Exhibit 4 shows that allocating to an emerging markets multi-factor portfolio provided a clear improvement. Another way to look at this is to examine the correlation between the value and momentum premiums in the two markets. The outperformances of the 50/50% multi-factor portfolios have a historical correlation of only 22%. This is an additional argument in favor of factor allocation in emerging markets.
The analyses only take into account portfolios made of equities and bonds without other asset classes, such as alternative investments. One could argue that adding these types of investments would likely increase the Sharpe ratio and therefore potentially lower the added value of emerging markets factor premiums. However, we are not aware of academic studies that show that alternative investments, such as commodities or mortgages, can explain the existence of value and momentum factor premiums.
Practical implementation
The results discussed so far do not consider management fees nor transaction costs. These can have substantial impact on actual returns. To investigate the effect of these costs, the results presented below contain a conservative approximation of their impact.
The downside risk and maximum drawdown were even somewhat lower for the factor portfolio
 The strategies analyzed above are created using simple portfolio construction rules with few assumptions. Therefore, they are not necessarily optimal from a net return perspective. De Groot, Huij and Zhou (2012) show that slightly more advanced portfolio construction rules deliver higher net returns after costs. In line with their methodology, dynamic portfolios are constructed where stocks are not immediately sold when they exit the top one-third most attractive stocks. Instead, each quarter, only stocks that no longer belong to the top 50% are sold. These stocks are then replaced by the most attractive stocks at that time not yet included in the portfolio. It is important to note that this dynamic approach leads to the same number of stocks in the portfolio as the static approach, but that the holding period with the dynamic approach can vary from one stock to another.
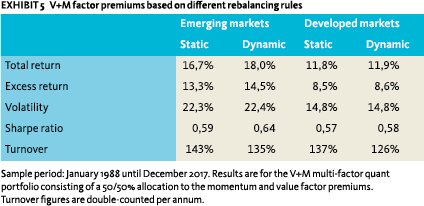
Exhibit 5 compares the return characteristics of the previously constructed static V+M factor portfolios in emerging and developed markets and the corresponding V+M factor portfolios based on the dynamic approach. The double-counted annual turnover of the strategies is also presented. The historical turnover is slightly lower for the dynamic approach than for the static approach. Interestingly, the returns increase. This is because stocks are not required to remain in the portfolio for six months at least anymore. On the one hand, stocks can be sold earlier (after three months) when they have become very unattractive (bottom 50%) while, on the other hand, when after six months, a stock just exited the top one-third group, it will remain in the portfolio. By holding on to more attractive stocks, on average, the return increases. Meanwhile, volatilities remain very similar.
 The following analysis focuses on the added value of allocating to emerging markets while taking into account trading costs. For that purpose, trading costs of 30 basis points for developed markets stocks and 50 basis points for emerging markets stocks are assumed. These include both market impact costs as well as commission fees. These estimates seem conservative compared to those of 9 basis points on average for the U.S. and 25-28 basis points for Europe, reported in De Groot, Huij and Zhou (2012). Also, although stocks are regularly included and excluded in market capitalization weighted indices, the turnover for these indices is conservatively assumed to be zero. In addition to trading costs, management fees are also considered. For passive developed markets a 10 basis points annualized fee is assumed and for emerging markets a 20 basis points annualized fee. For the factor portfolios, an additional 10 basis points per annum mark-up is assumed, leading to a total 20 basis points fee for developed markets and a total 30 basis points fee for emerging markets. For passive bonds, a 5 basis points management fee is assumed.
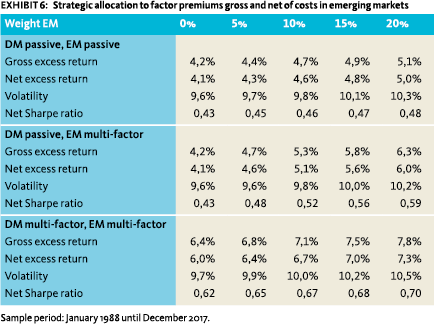
Exhibit 6 shows the results for factor portfolios with a dynamic construction process. The gross returns are the returns without any costs and fees assumptions, while the net excess return, volatility and net Sharpe ratio incorporate transaction costs and management fees. The observed improvements are similar to those reported in Exhibit 4. For example, allocating 20% to a multi-factor emerging markets portfolio increases the net Sharpe ratio with 0.16 compared to a passive developed markets portfolio that excludes emerging markets stocks. This number is similar before taking costs into account.
Another way to look at costs and the robustness of the results mentioned above is to investigate the so-called breakeven transaction costs for which the added value of allocating to the emerging markets factor portfolio is the same as for an allocation to the passive emerging markets portfolio. Only when the transactions costs are nine times higher than those assumed in the above analysis – that is 2.70% for developed markets and 4.50% for emerging markets – does the added value of allocating to the emerging markets factor portfolio disappear. For example, with these assumed transaction costs, allocating 20% to a multi-factor emerging markets portfolio increases the net Sharpe ratio to 0.49. This compares to 0.43 for a portfolio without allocation to emerging markets. Meanwhile, a 20% allocation to passive emerging markets leads a Sharpe ratio of 0.48. The excess returns are actually similar, but volatility is slightly lower for the factor portfolio, resulting in a slightly higher Sharpe ratio. There is still added value in allocating to emerging markets due to diversification benefits. The conclusion is that even when transaction costs and management fees are incorporated, allocating to emerging markets factor premiums still adds substantial value.
Robustness analyses
This section summarizes the results of several sensitivity analyses that give a better insight into the robustness of factor premiums. To avoid lengthy disclosure, these results are not reported. To evaluate the added value of emerging markets through time, the sample period is split in two equal sub-samples: from 1988 to 2002 and from 2003 to 2017. The results in both sample periods are in line with the findings for the complete sample. Allocating to passive emerging markets improved the Sharpe ratio of the portfolio in both sub-periods and even more when allocating to emerging markets factors.
Investors might also wonder how much of the additional return comes from allocation effects to sectors or countries. To answer that question, the monthly return of the factor portfolios is the equally-weighed return of the 33% most attractive stocks in each country (for emerging markets) and in each region/sector (for developed markets). Here again, the multi-factor emerging market portfolio showed a large Sharpe ratio improvement. However, the improvement in Sharpe ratio is smaller compared to the non-neutral results. This means that giving more weight to cheaper countries with strong momentum also added value.
Up to now, the portfolios are based on equallyweighting stocks. This results in relatively higher weights of small/mid cap stocks compared to the value-weighted index. The Sharpe ratio improvement of allocating 20% to emerging markets value-weighted factor portfolios to a passive developed equities portfolio is around 70% compared to using equally-weighted portfolios. Although somewhat smaller in size, the expected trading costs are also lower. This underscores that the results are also sufficiently robust taking into account size effects.
Expected factor premiums
The existence of factor premiums such as value and momentum has been widely acknowledged in the academic literature. However, there is no consensus on the underlying causes of these premiums. The explanations that have been proposed in different studies can be grouped into four categories: 1) the premium is a result of data mining; 2) the premium disappears when trading costs are taken into account; 3) the return premium is a compensation for a particular form of risk or 4) the premium has a behavioral explanation, meaning that the behavior of market participants systematically influences asset prices and thereby causes market inefficiencies.
Incorporating costs does not materially change the conclusion that allocating to emerging markets factor premiums would have added value
The data mining argument does not seem to be very plausible, given the abundance of historical evidence for the value and momentum factors in many markets and over very long periods of time (see e.g. Asness, Moskowitz and Pedersen, 2013). Trading costs are very important but, as shown in this study, substantial net factor premiums remain when advanced portfolio construction rules are applied. This explains why the focus in the literature has been on the risk and behavior explanations. For example, for the value premium, some academics argue that value is a compensation for risk, e.g. Fama and French (1992) and Vassalou and Xing (2003). However, others argue that is unlikely (De Groot and Huij, 2018) or suggest it is a result of structural mispricing arising from systematic behavioral biases of investors, e.g. Lakonishok et al. (1994). Although finding the exact explanation would help investors, this is not a necessary condition for the purpose of this study. If an investor believes the premium reflects behavioral biases, then the question is whether this behavior will persist in the future. And if the investor believes the premium is a compensation for risk, then the question is whether this risk will remain and be rewarded going forward.
Related to this topic is whether the magnitude of historical market and factor premiums will remain similar in the future. This is something difficult to determine and there seems to be no consensus on future expected premiums. However, several of the robustness analyses performed – for example focusing on the more recent time period or taking costs into account – shed some light on this question. Even in the case of very conservative assumptions on costs, allocating to the premiums added value.
Concluding remarks
Allocating part of an investor’s portfolio to emerging markets equities historically increased the portfolio’s risk-adjusted return. The added value is even larger when value and momentum factors in this asset class are taken into account. More advanced portfolio construction rules and the incorporation of conservative assumptions on transaction costs and management fees do not alter these conclusions. We therefore recommend investors to allocate part of their portfolio to factor premiums in emerging equity markets.
In this study the focus has been on the added value of relatively straightforward generic factors. Logically, investors may consider allocating to enhanced factor strategies in which more efficient factor definitions and more sophisticated portfolio optimization rules are used.
References
- Ang, A., W. N. Goetzmann, and S. Schaefer, 2009, Evaluation of Active Management of the Norwegian Government Pension Fund – Global, Report to the Norwegian Ministry of Finance.
- Asness, C. S., T. J. Moskowitz, and L. H. Pedersen, 2013, Value and Momentum Everywhere, The Journal of Finance, vol. 68 nr. 3: 929-85.
- Bekaert, G. and C.R. Harvey, 2017, Emerging Equity Markets in a Globalizing World, SSRN working paper.
- Bender, J., R. Briand, F. Nielsen and D. Stefek, 2010, Portfolio of Risk Premia: A New Approach to Diversification, The Journal of Portfolio Management, Winter 2010, vol. 36 nr. 2: 17-25.
- Blitz, D., 2012, Strategic Allocation to Premiums in the Equity Market, Journal of Index Investing, vol. 2: 42-49.
- Doeswijk, R., T. Lam, and L. Swinkels, 2014, The Global Multi-Asset Market Portfolio, 1959–2012, Financial Analyst Journal, vol. 70 nr. 2: 26-41.
- De Groot, W. and J. Huij, 2018, Are the Fama-French Factors Really Compensation for Distress Risk?, Journal of International Money and Finance, vol. 86: 50-69.
- De Groot, W., J. Huij and W. Zhou, 2012, Another Look at Trading Costs and ShortTerm Reversal Profits, Journal of Banking and Finance, vol. 36 nr. 2: 371-382.
- Fama, E.F. and K.R. French, 1992, The Cross – Section of Expected Stock Returns, Journal of Finance, vol. 47 nr. 2: 427-465.
- Ilmanen, A. and J, Kizer, 2012, The Death of Diversification Has Been Greatly Exaggerated, Journal of Portfolio Management, vol. 38 nr. 3: 15-27.
- Lakonishok, J., A. Shleifer, and R. W. Vishny, 1994, Contrarian Investment, Extrapolation, and Risk, Journal of Finance, vol. 49 nr. 5: 1541-1578.
- Jegadeesh, N., and Titman, S., 1993, Returns to Buying Winners and Selling Losers: Implications for Stock Market Efficiency, Journal of Finance, vol. 48 nr. 1: 65-91.
- Rouwenhorst, K., 1998, International Momentum Strategies, Journal of Finance, vol. 53 nr. 1: 267-284.
- Rouwenhorst, K., 1999, Local Return Factors and Turnover in Emerging Stock Markets, Journal of Finance, vol. 54 nr. 4: 1439-1464.
- Saunders, A. and I. Walter, 2002, Are Emerging Market Equities a Separate Asset Class?, Journal of Portfolio Management, vol. 28 nr. 3: 102-114.
- Van der Hart, J., Slagter, E. and D.C. Van Dijk, 2003, Stock selection strategies in emerging markets, Journal of Empirical Finance, vol. 10: 105-132.
- Van der Hart, J., D.C. Van Dijk, and G. J. De Zwart, 2005, The Success of Stock Selection Strategies in Emerging Markets: Is it Risk or Behavioral Bias?, Emerging Markets Review, vol. 6 nr. 3: 238-262.
- Vassalou, M. and Y. Xing, 2004, Default Risk in Equity Returns, Journal of Finance, vol. 59 nr. 2: 831–868.
Notes
- Wilma de Groot, PhD, CFA is Head Core Quant Equities at Robeco. Weili Zhou, CFA is Deputy Head Quant Equity Research at Robeco. We thank David Blitz, Jan de Koning and anonymous reviewers for their valuable comments.
- All excess returns in this study are on top of the one-month US Treasury bill rate. All return related figures are annualized and in US dollars (gross, unhedged), and do not include the impact of transaction costs or management fees, except for Exhibit 6. Average returns are calculated using geometric averaging.
in VBA Journaal door Wilma de Groot (l), Weili Zhou (r)