
Abstract
 Private equity is gaining popularity with Dutch institutional investors. At first sight its characteristics appear very attractive: high returns, low risk and low correlation with public equity and bonds. However, the risk characteristics in particular may be biased by the appraisal-based nature of private equity returns. For a better assessment of the ‘real’ private equity characteristics, we analyze the long term risk and return characteristics of private equity investments using a novel approach for “unsmoothing” reported private equity valuations. This approach consists of using longer (multi-year) investment horizons when estimating risk characteristics. We find that unadjusted historical private equity returns have generally been superior to those of public equity. Secondly our “unsmoothing” approach leads to higher volatility and correlation estimates, although volatility still turns out to be lower than for public stocks. We conclude that private equity adds value to traditional investment portfolios.
1. Introduction
In line with the global trend, Dutch institutional investors are showing increasing interest in alternative investments, especially in hedge funds and private equity. Cumming and Johan (2006) survey the attitude of Dutch institutional investors towards private equity and find that currently 29% of the respondents are investing in private equity, while another 6% of the respondents intends to invest in private equity over the next two to five years. Secondly, the respondents who already invest in private equity expect an increase of the private equity portfolio weight. Currently 44% of these respondents allocate more than 2.5% of their portfolio to private equity while this is expected to be 54% in the future.
Despite this enthusiasm there is not much formal research into the long term risk and return characteristics of private equity and its role in a mean-variance context. This study seeks to better understand the impact of adding private equity to the strategic asset mix. We present a novel, transparent approach to adjust the appraisal-based reported private equity valuations, in order to get a better estimation of the ‘real’ private equity volatility and correlation. In addition, most studies concentrate on the US market, while in this study we will include both US and European private equity, as well as the two main private equity sub-classes: buy-out capital and venture capital financing.
Earlier studies focus on the role of separate private equity classes in the strategic allocation for US public equity investors. The set-up of each study is different however, which may explain the mixed conclusions: Chen et al. (2002) suggest a 2-9% venture capital allocation, Milner and Vos (2003) recommend a 13% allocation for early stage and 69% for buy-out and Ennis and Sebastian (2005) suggest a 5% allocation for mixed portfolios with more than 60% equity allocations. To our knowledge only two studies, Artus and Teïletche (2004) and Kaserer and Diller (2004), focus on the European market, both concluding that investors should invest 5-10% of their total portfolio in private equity.
This study is organized as follows. We introduce the data in section 2. Sections 3 and 4 discuss private equity return and risk characteristics respectively. Section 5 combines the outcomes in a mean-variance framework and, finally, the conclusions are presented in section 6.
2. Data
In our research we use the Thomson Venture Economics (TVE) data, a Thomson Financial subsidiary, because of the relatively large scope of available data. TVE has gathered private equity data dating back to 1969, using annual reports of private equity funds, personal contacts to funds’ personnel, IPO prospectuses, investor public information such as prospectuses and other media sources. We refer to Kaplan et al. (2002), Kaplan and Schoar (2005) and Phalippou and Zollo (2005) for more information about the method TVE employs to collect the data.
TVE claims to cover a large share, as much as 70% of the total private equity market. However, like all providers of private equity data, they have to rely on (voluntary) reporting by investors and fund managers. This may give rise to a self-selection bias in the database, as successful funds may be more likely to report their performance than less successful ones. Furthermore, the historical database changes through time, as the track records of new funds are added (potential back-filling bias). The data might also suffer from survivorship bias, i.e. the exclusion of funds which have ceased to exist. Another issue is that return data provided by the funds is not verified by a third party, although generally the funds’ financial statements are independently audited. We feel comfortable to use the TVE data, as Kaplan and Schoar (2005) acknowledge the selection- and survivorship bias, but do not adjust for it. In a more recent working paper however, Phalippou and Zollo (2005) adjust historical returns in three ways and conclude that the expected performance of private equity funds is 2% lower after correction for sampleselection bias. We conclude that more effort needs to be done on this subject.
Due to the private nature of private equity investments, market valuations are not readily available. Investors have to rely on appraisal-based valuations instead, which tend to result in a smoothing effect. As value creation is a multi-year process for private equity, investments are usually kept at book value for up to several years. Subsequent accounting is conservative in the sense that clear justification must be available before an upward revaluation is done, for example a new financing round. On the other hand, a downward revaluation may be implemented more swiftly, e.g. when business prospects are judged to have deteriorated. When these smoothing effects are ignored, the estimated volatility of private equity and its correlation with other asset classes may be severely underestimated.
In our analysis we employ time-weighted pooled returns as reported by TVE’s VentureXpert website. Pooling refers to the aggregation of cash-flows and valuations over all funds for which data is available. Time-weighted indicates that a return is calculated for each period, based on initial and ending value and intermediate cashflows; these returns are subsequently chain-linked on an equally weighted basis. This approach is useful to discuss private equity performance on an index level. In practice the internal rate of return (IRR) is a more popular return measure for individual private equity funds. The IRR is defined as the rate of return that sets the net present value of all cash-flows equal to zero, but is not readily applicable for asset allocation purposes.
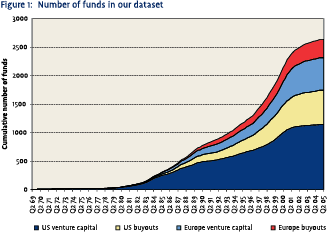 The number of funds in our dataset is shown in Figure 1. We observe that data is available from as early as the late sixties, though coverage is very low if we go back more than 20 years. The cumulative number of buy-out and venture capital funds rises steadily to over 2600 currently, with about a third of these being of European origin. The US funds represent a total value of over $600 billion, while the European funds total over €140 billion. Despite the fact that the number of venture capital funds is about twice the number of buyout/mezzanine funds, they represent less than a third of the total value. Return data for other regions, most notably the Pacific, are not available (yet).
We will compare US private equity with US stocks and bonds as represented by the S&P 500 and Lehman Aggregate total return indices respectively, all in US dollars. European private equity will be compared with European stocks and bonds (MSCI Europe and JP Morgan EMU aggregate), all in euros. Data for the traditional equity and bond indices have been obtained from Thomson Financial Datastream.
3. Return of private equity
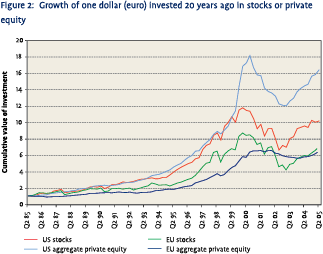
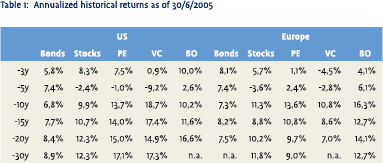 Table 1 provides an overview of the annualized (timeweighted) historical returns of private equity, as well as those of traditional stock and bond investments. In addition to the aggregate returns on private equity (PE), the returns associated with the venture capital (VC) and buy-outs/mezzanine (BO) sub-styles are also displayed. Figure 2 compares the growth of one dollar (euro) invested twenty years ago in US (European) private equity to public stocks.
Based on the return data in Table 1, US private equity has clearly outperformed public equity in the long term. European private equity shows mixed results however, outperforming stocks over the past 5, 10 and 15 year period, but underperforming in earlier years (the past 20 and 30 years). This is in line with the findings of Kaserer and Diller (2004). Note that European private equity was still an immature asset class in the early days, with the total number of funds being below 100 until 1989 and even less than 10 until 1983. Table 1 also shows that, in contrast to the US, European buyouts performed better than venture capital over the last 15 and 20 years. A possible explanation for this could be the fact that during the 1980s successful US venture capital business models were directly applied in Europe. Unfortunately venture capital managers learned their lessons as these concepts needed to be adjusted to be used in Europe. In addition, the exit market for VC investments was lacking in Europe.
 US private equity generated higher returns than public equities during both the bull market of the late nineties and the subsequent bear market. European private equity exhibits less extreme returns during both periods, with the bear market being quite mild in particular. The venture capital sub-style did exceptionally well during the bull market, while buy-outs were more rewarding during the bear market, even managing to achieve positive absolute returns on average during these difficult years.
One of the key issues in every asset allocation study is to what extent the historical average nominal return of an asset class is representative for its future expected return. For example, with bond yields having declined to levels of approximately 4% currently, future expected returns on bonds are clearly lower than the historically realized levels of 7-8%.
Theoretically there are good reasons to assume a systematically higher risk premium on private equity than on public stocks. The three main arguments follow from economic theory: a lower market efficiency, a liquidity premium and compensation for higher risk:
- Lower market efficiency refers to several important differences between private equity and public equity. In public markets information is abundantly available and distributed quickly to all market participants. The private equity market clearly does not share these characteristics. Well-informed private equity managers can have an informational advantage and may add additional value by being directly involved in comanaging the companies in which they invest. This is confirmed by Kaplan and Schoar (2005) who report strong persistence in fund returns across different funds from the same general partner. Although such market inefficiencies complicate the analysis of private equity, they may actually be an important source of excess returns for investors.
- Liquidity in the private equity market is much lower than in public markets and transaction costs are higher. The illiquid nature of private equity warrants a liquidity premium for investors.
- Private equity investors can also expect an excess return relative to public stocks because of the inherently riskier nature of the underlying investments. Venture capital investments are known to be more risky than their large-cap counterparts as their business is not well diversified, future cash-flows are relatively uncertain and the probability of failure (bankruptcy) is relatively high. The transaction values of buyout investments are usually larger than that of venture capital investments, and business prospects are associated with less uncertainty. However, buyouts often involve significant debt leverage, which increases risk. As we will see in the next section, quantifying the level of risk associated with private equity is not an easy task. Nevertheless, it makes sense to assume a higher inherent risk for private equity than for public stocks, for which investors are rewarded by means of a higher expected return.
In practice the excess return of private equity versus public equity may be partly diluted due to higher management costs. Returns for private equity funds in our sample are on an after-cost (net) basis, but investing in these funds usually involves additional costs, such as retaining specialized investment professionals or hiring an external asset manager. For example, the typical management fee of a private equity fund-of-funds is 1%. In practice we see that the largest Dutch institutional investors have their own private equity professionals, while for smaller investors an external manager is economically more efficient. Fund-of-funds managers strive to at least make up for the additional layer of management fees by trying to select superior funds. Arguably, prospects for active management of private equity are relatively good, given the lower market efficiency and persistence in fund returns, as addressed earlier. Active fund selection is in fact both necessary, as no passive investment alternatives exist for private equity, and essential as returns of individual funds exhibit a large dispersion. This dispersion is very large when compared to dispersion in returns of diversified public equity portfolios. Therefore it is worth to put effort in trying to select the best funds and avoid the worst funds. For example, the median return for US private equity was 21% in 1999, but fund returns range from a median of -4% for bottom quartile funds to a median of 95% for top quartile funds.
Our data suggests that private equity indeed offers a higher long term average return than public stocks, although admittedly the European data is not totally unambiguous in this respect. We should also bear in mind that the data may suffer from the kind of biases discussed in the previous section. The literature on hedge funds suggests that such biases can result in significantly overestimated returns, compared to the returns that would have actually been achieved by investors. Currently there is no consensus if, and if so, to what extent, the private equity dataset we use also suffers from these biases. Phalippou and Zollo (2005) are the first authors that shed light on this issue, penalizing historical returns by -2% due to a sample-selection bias.
There is also a lack of consensus regarding private equity returns in the limited number of papers on this subject: Ljungqvist and Richardson (2003) calculate excess-IRRs to the S&P 500 of 5-8% per year, Jones and Rhodes-Kropf (2003) claim positive although not significant excess returns for buyout and venture capital funds over stocks as “the higher returns are commensurate with the factor risks that private equity investors bear”, Kaplan and Schoar (2005) conclude that “average fund returns approximately equal the S&P 500 although substantial heterogeneity across funds exists”, while Phalippou and Zollo (2005) conclude that the returns lag the S&P 500 by -3.3% after a correction for sample bias and “living dead” investments. These return differences can be explained by different data sources, time periods, data-samples or data adjustments.
Because of this ambiguity we will use different scenarios for the expected return of private equity in the remainder of this paper, instead of trying to make one best guess.
4. Risk of private equity
 A. Volatility
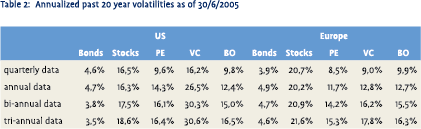
In Table 2 we calculate annualized volatilities on quarterly as well as (overlapping) annually, bi-annually and tri-annually (log-transformed) returns. The volatility of quarterly returns is remarkably low, in particular in comparison to public stocks. However, as the investment horizon is lengthened, volatility is observed to increase significantly. Nevertheless, even at a three year horizon the levels resulting for aggregated private equity are still below those of public stocks.
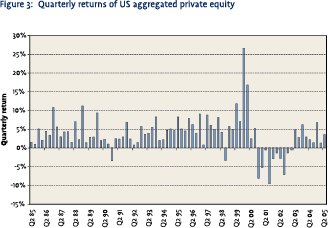 Our finding that volatility increases as the investment horizon is extended is not surprising, as quarterly returns exhibit significant positive serial correlation. On a quarterly basis, positive returns tend to be followed by more positive returns, and negative returns by more negative returns. This behavior is confirmed by a visual assessment of the development of quarterly returns over time, as shown in Figure 3. The positive serial correlation implies that long term risk is higher than short term figures may suggest at first sight. As we are interested in the long term value-add of private equity, risk statistics that are adjusted for short term serial correlations are more appropriate. Measuring volatilities over longer investment horizons is a simple yet effective way to accomplish this. The differences between short term and long term volatilities find their root in the appraisal-based valuations on which we are forced to rely due to absence of frequent mark-to-market valuations.
Similar characteristics of appraisal-based returns have been documented for other non-listed asset classes, most notably direct real estate. In fact, the real estate literature provides additional inspiration for unsmoothing appraisal-based valuations. For example, Pagliari et al. (2003) find that the application of an unsmoothing methodology to annual direct real estate returns increases the estimated annualized volatility from 5.20% to 8.59%, i.e. over 65% in relative terms.
B. Correlation
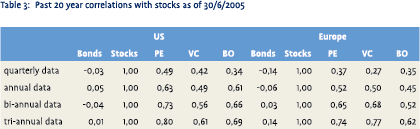 Using a longer investment horizon does not only affect estimated volatility levels. Table 3 shows that the estimated correlation between private equity and stocks increase sharply as we lengthen the investment horizon. In other words, the correlation with stocks is also higher than it appears initially. This is in line with the findings of Emery (2003), Artus and Teitletche (2004) and Kaserer and Diller (2004), who use different correction methods but reach the same conclusion. Nevertheless, diversification benefits exist, in particular for European private equity.
A final advantage of focusing on longer holding periods is that the return data exhibits considerably less non-normality. Statistically significant positive skewness (asymmetry) and excess kurtosis (fat tails) is observed for quarterly returns, but these effects diminish rapidly at longer horizons. The more closely the data resemble a normal distribution, the more valid it is to apply mean/variance for assessing the attractiveness of a specific allocation.
5. Mean/variance analysis
In the preceding sections we separately discussed the return and the risk associated with private equity. At this point we combine these factors by analyzing consequences for both risk and return if private equity is added to an existing equities and bond portfolio. This is done by applying a mean/variance approach to scenarios with varying risk and return characteristics of private equity.
The following assumptions are used in each scenario and are commonly used in ALM studies in practice:
- 3% expected annual risk premium on equities over bonds.
- 20% risk (annual volatility) of stocks and 5% risk of bonds
- Zero correlation with bonds for both public stocks and private equity
The zero correlation assumption is conservative for private equity, as historical correlation with bonds has in fact been slightly negative.
In the scenarios for private equity we distinguish between:
- A 3% or 5% annual risk premium on private equity over bonds. The 5% scenario is consistent with unadjusted historical data and with the expectations of respondents in the Cumming and Johan (2006) survey. The 3% scenario reflects identical return expectations for private equity and public equity.
- An 18% or 27% risk (annual volatility) for private equity. The 18% volatility (and 0.8 correlation with stocks) are the maximum risk and correlation levels implied by historical data. We also include a scenario in which private equity is assumed to be significantly riskier than public equity (which tends to be the consensus among investors in practice), consisting of a subjectively chosen 27% volatility (and 0.9 correlation with stocks).
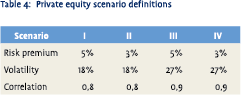 The four resulting scenarios are summarized in Table 4. Scenario I was designed to be most consistent with the historical data discussed in previous sections. The other scenarios represent more conservative assumptions regarding private equity.
In our mean/variance analysis we compare the efficient frontier of portfolios consisting only of stocks and bonds with the one in which a fixed allocation to private equity of 10% is included. Substantially higher allocations may in fact be optimal from a statistical point of view, but as most institutional investors will not consider these to be a realistic alternative in practice, we restrict our attention to private equity allocations of 10%.
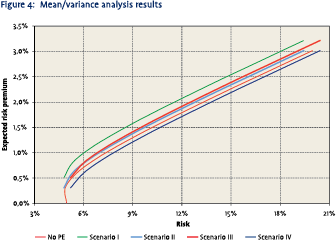 The resulting efficient frontiers are shown in Figure 4. Not surprisingly, we find strong evidence of added value in Scenario 1. Based on this scenario the expected risk premium is enhanced by about 0.25% for the same level of risk, or, alternatively, risk can be reduced by about 2% whilst preserving the expected return level. At least as important is the finding that even assuming the same risk premium as on stocks (Scenario II) or a significantly increased risk level (Scenario III), an allocation to private equity still adds value. Only in case both these assumptions are used (Scenario IV) do we find a deterioration of the efficient frontier.
6. Conclusion
Private equity is gaining popularity with Dutch institutional investors, but research in this area is still relatively scarce. In this paper we analyzed risk and return characteristics with a novel approach, which unsmoothes the reported private equity valuations for a better estimation of the private equity characteristics that long term investors might experience in their portfolios.
Using aggregated data from Thomson Venture Economics we find that US private equity returns have generally been superior to those of public stocks. It is unclear to which extent the TVE data suffers from certain potential biases, but even after a downward adjustment of average returns by several percentage points, private equity returns would still exceed, or at least be comparable to public stock returns. European private equity outperformed public stocks over the past 15 years, except in earlier years, when, arguably, the number of funds was still small, indicating an immature market. We argue that superior returns are in line with general economic theory, as being caused by lower market efficiency, illiquidity and compensation for higher risk.
Using volatility as a risk measure we find a lower risk for both European and US private equity compared to public stocks. After correcting the appraisalbased returns, by lengthening the investment horizon up to three years, the estimated risk levels rise, although they remain lower than for public stocks. This can be explained by positive serial correlation in short term returns, which are most likely the result of the appraisal-based valuations that are inherent to private equity. We conclude that the higher risk estimates, following from longer horizon returns, are more reflective of the “true” amount of risk involved. For the correlation between private equity and public equity we also find higher values after applying our unsmoothing approach.
We combined risk and return characteristics in four mean/variance scenarios and found that private equity adds value to a traditional equity and bond portfolio. Only under extreme assumptions, private equity would not add value to this traditional portfolio.
References
- Artus, P. & Teïletche, J. 2004, ‘Asset allocation and European private equity: a first approach using aggregated data’, in ‘Performance Measurement and Asset Allocation for European Private Equity Funds’, Research Paper, European Private Equity & Venture Capital Association (EVCA)
- Chen, P., Baierl, G.T. & Kaplan, P.D. 2002, ‘Venture Capital and its Role in Strategic Asset Allocation’, Journal of Portfolio Management, Winter, vol. 28(2), 83-89
- Cumming, D.J. & Johan, S.A. 2006, ‘Regulatory Harmonization and the Development of Private Equity Markets’, Working Paper, http://ssrn.com/abstract=842964
- Emery, K. 2003, ‘Private Equity Risk and Reward: Assessing the Stale Pricing Problem’, Journal of Private Equity, Spring, vol. 6(2), 43-50
- Ennis, R.M. & Sebastian, M.D. 2005, ‘Asset Allocation with Private Equity’, Journal of Private Equity, Summer, vol. 8(3), 81-87
- Jones, C.M. & Rhodes-Kropf, M. 2003, ‘The Price of Diversifiable Risk in Venture Capital and Private Equity’, Working Paper, Columbia University
- Kaserer, C. & Diller, C. 2004, ‘European private equity funds – a cash flow based performance analysis’, in ‘Performance Measurement and Asset Allocation for European Private Equity Funds’, Research Paper, European Private Equity & Venture Capital Association (EVCA)
- Kaplan, S.N. & Schoar, A. 2005, ‘Private Equity Performance: Returns, Persistence and Capital Flows’, Journal of Finance, vol. 60(4), 1791-1823
- Kaplan, S.N., Sensoy, B.A., & Strömberg, P. 2002, ‘How Well Do Venture Capital Databases Reflect Actual Investments?’, Working Paper, University of Chicago
- Ljungqvist, A. & Richardson, M.P. 2003, ‘The Cash Flow, Return and Risk Characteristics of Private Equity’, Finance Working Paper No. 03-001, New York University
- Milner, F. & Vos, E. 2003, ‘Private Equity: A Portfolio Approach’, Journal of Alternative Investments, Spring, vol. 5(4), 51-65
- Pagliari, J.L., Scherer K.A. & Monopoli R.T. 2003, ‘Public versus Private Real Estate Equities’, Journal of Portfolio Management, Special Issue, 101-111
- Phalippou, L. & Zollo, M. 2005, ‘Performance of Private Equity Funds: Another Puzzle?’, EFA 2005 Moscow Meetings Paper, http://ssrn.com/abstract=473221
in VBA Journaal door Gerben de Zwart, David Blitz, Mikan van Zanten, Brian Frieser