
 Introduction
Upheavals in international financial markets, low yields on traditional investments, and the threat of inflation resulting from quantitative easing are causing an increasing number of investors to evaluate alternative asset classes. With recent allocations to farmland and timberland from key institutions including the Harvard Endowment Fund, a trend may be emerging for these natural real assets to form larger proportions within investment portfolios. This short paper aims to interpret farmland investments in the context of other asset classes, and to empirically assess their return and risk characteristics using datasets from the United States and New Zealand.
Farmland investment in the context of other asset classes
Farmland is an asset class that provides a legal claim on land, and the agricultural produce that is grown on that land, in perpetuity. The returns from farmland are like those of a perpetual bond, with the proviso that operational farming returns show high volatility, being largely driven in the short term by climatic conditions and commodity prices. Bonds are typically priced at between 20 and 50 times returns, which is consistent with farmland price multiples. In contrast, equities in a moderate growth sector generally trade at a price to earnings ratio of approximately 10, making farmland look less attractive if perceived as a stock.
 Like other real assets farmland is protected against inflation, as is farm production. Farmland is thus similar to an inflation-protected perpetual bond with a variable yield, where both principal and coupons are protected against currency depreciation.
Within the group of real assets, farmland is most similar to commercial property. Both are illiquid investments, being traded in private markets, and both generate operational returns. However, there are three principal differences. Firstly, unlike a commercial building, which physically depreciates, well-stewarded farmland increases its productivity over time. Secondly, commercial property rents are specified in nominal terms, whereas farmland grows real commodities which are then exchanged for currency. Thirdly, commercial property returns come from capital gains and rental income, whereas farmland investments generate changes in capital value, together with either rents or returns from farming operations.
Data
The combination of short term volatility with long term stability makes modelling farmland investments challenging. These difficulties are compounded by the governance systems that prevail in the sector. In US, NZ, Australian, Canadian and other agricultural sectors, owner-operators typically control over 90% of farms. The majority of the available sector data is based on actors who “own” the assets in a different way from institutional ownership. Most previous studies of farmland investment returns, for example Nartea and Eves (2010) and Eves and Painter (2008), have not analysed returns to institutional investors. The National Council of Real Estate Investment Fiduciaries Farmland Index (NCREIF 2013) was chosen to represent these returns, a relatively recent index that has been used in only limited studies previously, such as Hennings, Sherrick and Barry (2005). This index is a quarterly time series composite return measure of farmland investment performance from 1991, based on a large pool of individual United States agricultural properties purchased, at least in part, on behalf of taxexempt institutional investors – the great majority being pension funds. All properties are held in a fiduciary environment, and investment returns are reported on a non-leveraged basis.
 While the NCREIF provides returns to institutional investors, it includes a range of sectors and governance styles. A second dataset compiled by the industry-good association DairyNZ (DairyNZ, 2012) was chosen to represent returns to dairy farmers in New Zealand. This dataset comprises a majority of owner-operators (including share-farmers/sharemilkers), and thus measures the performance of a particular sub-asset class with a relatively homogenous governance form.
As with many datasets, especially for illiquid and alternative assets, both the NCREIF and the DairyNZ data may be subject to biases and distortions. These include firstly, the possibility of selection and sampling biases, such as only top-performing farmers reporting their results to DairyNZ, or only a subset of investors joining NCREIF. Secondly, “stale pricing” biases, where land values result from estimates rather than transactions, tending to understate returns volatility in both datasets. A third form are “survivorship” biases, as only successful farms will survive and be reported – the unsuccessful being excised from NCREIF members’ portfolios, and changing ownership in New Zealand. Positively, both the NCREIF and the DairyNZ datasets are produced for non-marketing purposes.
Other asset classes chosen for analyses were bonds and equities, using the Dutch 10 year government bond, the MSCI World Index for equities, and the German one year sovereign return for the risk-free rate.
All returns data were adjusted from the point of view of a Dutch investor, with foreign currency returns adjusted for the relative performance of the USD and NZD versus the Euro (and the Dutch Guilder in the pre-Euro period).
 Historical Returns
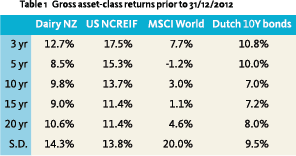
The calculated returns and short-term volatilities (Table 1) that a Dutch investor would have received (assuming no management fees or other transaction costs), for different periods in the two decades to 2012 replicates the consensus in the literature (Eves and Painter 2008, Hennings et. al. 2005, Nartea and Eves 2010, Painter 2011). Farmland investments generally show a higher total return than bonds or most equities, with intermediate values for short-term returns volatilities.
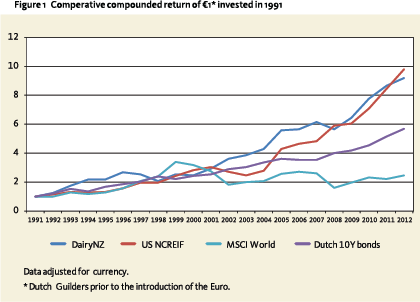
Relative compound growth rates for the first decade analysed (1991 – 2000) were similar for all asset classes. However more recently farmland has outperformed bonds and equities, as a result of strong agricultural commodity prices after decades of relative stagnation. A key driver of these increasing prices has been China becoming a significant net importer from the turn of the century, and the consequent drawdown of global stocks.
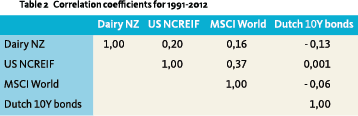
Whilst the two types of farmland have shown very similar performances over the longer term, their short-term correlation is low at 19.5%, as shown in Table 2. Both types of farmland show low or negative correlation with equities and bonds, supporting the general findings of the literature (e.g. Painter 2011: 5; Nartea and Eves: 204).
 Mean-Variance Analysis
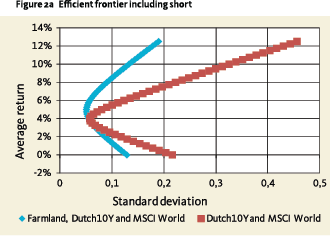
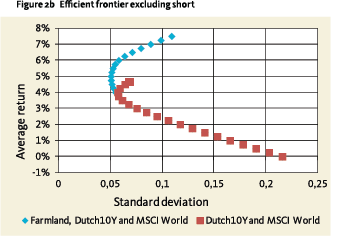
A well-established tool for assessing the impact of the inclusion of an asset class on an institutional portfolio is Markowitz’s mean-variance analysis. To simplify comparisons between the asset classes, a composite farmland index of 50% Dairy NZ and 50% NCREIF returns was created. Figure 2a compares the efficient frontier for a two-asset portfolio (MSCI World and Dutch 10 year bonds) including short positions, with a three-asset portfolio (including the composite farmland index).
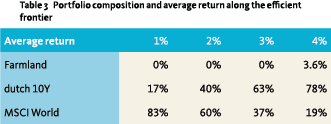
Figure 2b repeats the comparison, excluding shorts. For the purpose of this analysis it was assumed that the institutional investor cannot take short positions (Fig. 2b), giving the corresponding portfolio weights shown in Table 3. The addition of farmland creates a more attractive frontier. In particular adding a farmland investment of about 4% of the total portfolio moved the inflection point upward and to the left, slightly reducing the volatility of the total portfolio and lifting its returns from 4% to 5%.
Further Risks
The mean-variance framework allows the comparison of returns with short-term volatility risks in a total portfolio. However, this is only one of the many risks that an investor faces, and the following sections examine further risks and uncertainties.
Inflation
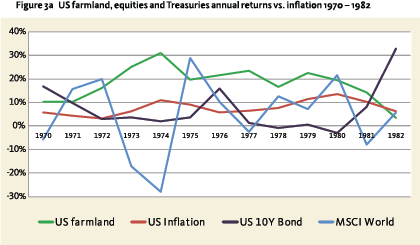 The assumption that farmland can protect its owners against inflation was also tested. The datasets used for the previous analyses are inappropriate here, as there have been low rates of inflation both in the Netherlands and internationally in the period 1991-2012. It is instructive to look at a period of high inflation and to compare the nominal performance of farmland compared to other assets, and to inflation itself. The years 1970-1982 were chosen for the high inflation period, and USDA datasets were used for farmland returns and compared to US inflation, US 10 year Treasury bonds, and MSCI World Index returns (Fig. 3a)
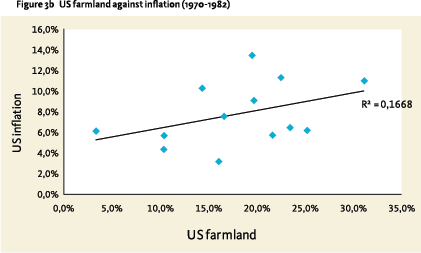
In the period 1970-1983, when the US experienced high and fluctuating inflation, US farmland returns systematically exceeded consumer price increases. Improvements in farmland returns coincided with increases in the level of inflation, particularly during the 1973- 1974 oil crisis (Fig. 3b). In comparison, equities were volatile and often underperformed inflation, while bonds systematically underperformed inflation, then outperformed strongly as inflation returned to more moderate levels.
Illiquidity
 In many cultures landholders are very reluctant to sell what are often family assets that have been built over generations. In New Zealand, where the market is regarded as being relatively liquid, there are normally about 250-300 of the 11,500 dairy farms traded each year, corresponding to 2-2.5% per annum (DairyNZ 2012). Comparable levels of liquidity have been reported for other regions: in Minnesota farmland worth USD 600 to 900 million is traded annually, of an estimated USD 80 billion total farmland asset (Minnesota 2013), representing an approximately 1% annual asset turnover. Similar findings have been made for Illinois farmland (Sherrick 2012).
Despite farmland markets being relatively illiquid, the market has scale. Conservative estimates for the total value of farmland are around USD 8.3 trillion, with USD 1 trillion being perceived as investable (Macquarie 2012, p. 7). The assumption that 1% of these investable farms are being traded each year leads to an estimate of USD 10 billion of global farmland sales annually.
Farmland illiquidity would appear similar to commercial real estate: the scale of the market and the number of sales allows scale institutional investment, but transactions require time and management commitment. For investors who are able to invest for the long term, the preceding risk and returns data supports the wider evidence that, as with other illiquid asset classes, there is an illiquidity premium for farmland.
Capital preservation
Security of property rights is of critical importance to farmland investments, both to the land itself and to its production. Many regions of the world are subject to resource nationalism which brings the risk of direct or indirect expropriation, such as through the imposition of export controls.
Governance style, operational and manager risks
Farming is well known for its operational risks, such as commodity price instability and adverse weather. It might appear that an investor could shield himself by leasing the property to a tenant farmer or other operator. This may be misleading. In the sectors of agriculture where informational asymmetries and agency problems are pronounced, such as in pastoral farming, it may be possible for the farm asset to degrade (e.g. soil fertility) without the landowner being able to effectively monitor and control the process. Allied with this, the choice of the farm manager is one of the critical farmland investment decisions, as a good manager will systematically outperform his peers and will be able to manage the large number of varied risks that a farming business faces.
Conclusion
This paper provides an insight into farmland investment from the perspective of an institutional investor, arguing that it is analogous to an inflation-protected perpetual bond that delivers inflation-protected returns, albeit with significant short term volatility and governance and operational challenges.
Empirical evidence shows that, using the datasets and periods chosen, farmland returns outperformed both equities and bonds. In a meanvariance analysis a relatively small (4%) asset allocation to farmland increased the minimum-risk portfolio returns from 4 to 5% per annum, as a result of the high comparative returns and the low correlations with the other asset classes.
The final sections examined various investment risks, showing that farmland as a real asset consistently outperformed inflation in the US in the period 1970-1982. It was argued that the illiquidity is one factor behind the apparently attractive risk-return profile, that capital preservation is of prime importance in farmland investing, and that the choice of manager and governance system has broad consequences.
This initial analysis and findings represent the first steps in a deeper investigation of farmland and natural resource investments. The authors are participating in an initiative, centred upon the Smith School of Enterprise and the Environment at Oxford, to collate, analyse, and publish information about natural resource investments and their implications.
Referenties
- Dairy New Zealand (2012), “DairyNZ Economic survey 2010-2011 & previous years”, http://www.dairynz.co.nz/page/pageid/2145871201/DairyNZ_Economic_Survey [Accessed 15 April 2013]
- Eves, C., Painter, M. (2008) A comparison of farmland returns in Australia, Canada, New Zealand and United States. Australian & New Zealand Property Journal, 1(7). pp. 588-598.
- Hennings, E., Sherrick, B. J., & Barry, P. J. (2005). Portfolio Diversification Using Farmland Investments. AAEA Annual Meeting, 27 July 2005
- Macquarie Agricultural Funds Management (2012), “Farmland: an untapped asset class? Quantifying the opportunity to invest in agriculture”, Food for Thought, (December) pp. 3-7
- Minnesota Land Economics (2013), “Farmland Sales”, http://www.landeconomics. umn.edu /MLE/landdata/ FarmLandSale / RunReport.aspx?RI=17054 [Accessed 15 April 2013]
- Nartea, G. & Eves, C. (2010) Role of farm real estate in a globally diversified asset portfolio. Journal of Property Investment and Finance, 28(3).pp. 198-220.
- National Council of Real Estate Investment Fiduciaries (2013), “NCREIF farmland returns”, http://www.ncreif.org/farmland-returns.aspx [Accessed 15 April 2013]
- Painter, M.J. (Sept. 2011), “Is Farmland as Good as Gold?”, Economics Research International (2011: Sep., 8 pp.)
- Sherrick, B. J. (2012) “Farmland turnover in Illinois”, http://farmdocdaily.illinois. edu/2012/11/farmland-turnover-in-illinois.html [Accessed 15 April 2013]
Noten
- Affiliations: 1 Milliman, 2 Smith School of Enterprise and the Environment, Oxford University, 3 Craigmore Research. Names are in alphabetical order.
in VBA Journaal door Rik van Beers, Sander Bierman, Charles Elworthy, Dane Rook, Jérôme Schoumann