
 Introduction
Academic research has shown that a simple investment strategy based on momentum in stock returns is profitable. Former research mainly concentrated on stock momentum in the United States (Jegadeesh & Titman, 1993 and Chan, Jegadeesh & Lakonishok, 1996), but also on stock momentum in other regions (Rouwenhorst, 1999). The research has been extended by testing momentum for countries and sectors (Chan, Hameed & Tong, 2000 and Moskowitz & Grinblatt, 1999).
While former research was limited to specific regions or countries, we use in our research a global sample of stock returns to test momentum strategies. We furthermore extend the analysis of momentum strategies by splitting up the raw stock returns in four components: a global market return, a pure country component, a pure sector component and a stock specific return. In this way we can test stock specific momentum strategies and pure country and sector momentum strategies, and see if the conclusions of former research will change. At the same time we can determine the cause of the profitability of stock momentum strategies.
Overview of research on momentum strategies
Evidence on the profitability of momentum strategies is extensive. Jegadeesh & Titman (1993) find for the US stock market that over a horizon of three to twelve months a strategy of buying past winners and selling past losers will generate about 1% performance per month. In a more recent paper (Jegadeesh and Titman, 2001) they show that momentum profits have continued in the 1990s. The persistence of performance is not specific to the US stock market. As Rouwenhorst (1998) demonstrates a European sample.
Jegadeesh & Titman (1993) suggest the explanation for the momentum effect might be irrational behaviour by market agents. According to Chan, Jegadeesh and Lakonishok (1996) the market takes time to adjust to news. Several behavioural models that are based on cognitive biases by investors have been developed to explain return continuation. The model of Barberis, Shleifer & Vishny (1998) incorporates how investors form expectations on future earnings. Daniel, Hirshleifer & Subrahmanyam (1998) model overconfidence of investors, causing stock prices to overreact. In the model of Hong & Stein (1999), which features two types of irrational agents, information diffuses only gradually across the investing public. The findings of Hong & Stein (2000), that momentum strategies work better for small stocks and stocks with low analyst coverage, confirm the gradual spreading of information.
There are also explanations, which are consistent with efficient markets. Conrad & Kaul (1998), Berk, Green & Naik (1999) and Chordia & Shivakumar (2001) for example find the explanation in the cross-sectional variability in expected returns. Jegadeesh and Titman (2000), however, refute the argument of Conrad & Kaul that the dispersion in expected returns generates momentum profits. Return continuation in the first twelve months after the formation period, which is followed by return reversal in months thirteen to sixty, is more in line with overreactions that are eventually reversed. Furthermore, Grundy & Martin (2000) find that the profitability of a momentum strategy cannot be explained by extra risk exposure to the three factors of the Fama and French model, nor by cross-sectional variability in stocks’ average returns.
The outperformance of momentum strategies is useful for stock selection. But also for country and sector selection return continuation can be a useful selection criterion. Chan, Hameed & Tong (2000) implement momentum strategies on international stock market indices. Their conclusion is that a global asset allocation strategy that reallocates an equity investment from loser to winner countries will outperform a buy-and-hold strategy. The profits arise mainly from return continuation in stock market indices, very little comes from currency momentum. Asness, Liew & Stevens (1997) compare the profitability of stock momentum strategies in the US stock market with a country momentum strategy (based on 18 MSCI country indices). They find that patterns in profitability for country momentum strategies are comparable to stock momentum strategies in the US.
Industry momentum investment strategies in the US stock market, which buy stocks from past winning industries and sell stocks from past losing industries, are also highly profitable according to Moskowitz & Grinblatt (1999). Moskowitz & Grinblatt find that much of the individual stock momentum anomaly is actually accounted for by industry components of stock returns. These results are in contrast to those of Asness, Porter & Stevens (2000), who find that the profitability of a market wide momentum effect can be explained by both a strong within-industry momentum effect and a strong across-industry momentum effect. Grundy and Martin (2000) and Chordia and Shivakumar (2001) show furthermore that industry momentum alone does not explain the profitability of stock momentum strategies. To test the practical consequence of using a sector momentum strategy, O’Neal (2000) tests the profitability of buying the best performing sector mutual funds. This strategy beats the S&P 500 in the period 1989 through 1999, but entails greater risk than buying the index.
Data & methodology
Data – In our research we use total returns on stocks from 22 developed countries in the period January 1987-January 2000. To adjust for disturbances due to currency movements we use hedged returns. The composition of the universe changes every month. We use a market capitalisation restriction to determine which stocks we will use in our research. The minimum market cap required in December 1999 is USD 500 million. We use this restriction to exclude small and illiquid companies from our universe. We deflate this market cap restriction with 0.8% per month. This implies that the minimum market cap is about 10% lower in December 1998, and another 10% lower the year before that. Because the stock market rises about 10% a year on average, the number of stocks in our universe remains reasonably stable. Moreover, in this way we always focus on the largest companies in a specific period. This also reduces survivorship bias in the universe. We use Compustat data on market capitalisation and returns on US and Canadian stocks, and Worldscope and Factset data for the other countries. To divide the universe in sectors we use the MSCI sector classification.
To determine whether the profitability of a global stock momentum strategy can be explained by stock specific momentum, or is due to a country or sector momentum effect, we use pure stock, country and sector returns. For each month, we calculate these returns by estimating the following cross-sectional regression model:
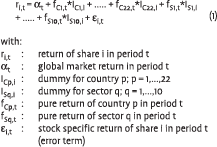
These returns cannot be estimated directly as there is perfect multi-collinearity between the country dummies as well as the sector dummies, as each share is part of exactly one country and one sector. This problem can be solved by estimating the sector and country returns, compared to an equally weighted benchmark. As a result the average of country returns and the average of sector returns are equal to zero.
If we look at an American energy company for example, the total return can be partly explained by market sentiment, partly by a country effect e.g. economic growth in the US, partly by a sector effect e.g. a change in the oil price, and partly by firm specific effects. The cross-sectional regression filters all these components out of returns and leaves only pure stock, country and sector returns.
Methodology – Based on the data described in the previous paragraph we compose monthly relative strength or momentum portfolios. At the end of each month all stocks, or countries, or sectors are ranked into quintiles based on their returns in the past 1, 6 or 12 months. The first quintile reflects the winner portfolio (the highest past returns) and the fifth quintile reflects the loser portfolio (the lowest past returns). These portfolios are held for six subsequent months, during which period the portfolios are not rebalanced. Our strategy implies buying the winner portfolio and selling the loser portfolio. Because the holding period exceeds the interval over which return information is available, an overlap occurs in the holding period returns. Therefore we adopt the same method of performance calculation as in Jegadeesh and Titman (1993) and Rouwenhorst (1998). This means that we report the monthly average return across six portfolios, each starting one month apart to handle the issue of overlapping observations.
 Results of a simple stock momentum strategy
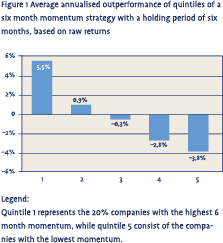
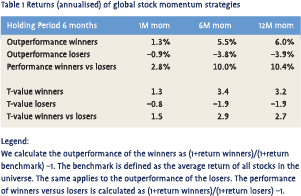 Momentum in global raw stock returns – First we test a simple global momentum strategy, based on raw stock returns. Buying world wide the 20% best performing stocks over the last six or twelve months and selling the worst performing stocks yields a significant performance of 10% per year (Table 1). Both the persisting high performance of past winners and the persisting bad performance of past losers can explain the significant high performance. In Figure 1 we show the results of the five quintiles we distinguish, based on a six month momentum strategy using raw returns. The profits are decreasing steadily from the first quintile (highest momentum) to the last quintile (lowest momentum), as can be seen in Figure 1.
A 1-month momentum strategy gives an insignificant return with a holding period of six months. We have also tested the strategies with a 1-month holding period. In that case a 1-month momentum strategy even gives a negative return (results not shown), although the result is insignificant.
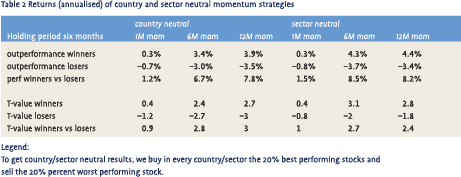 Country neutral and sector neutral results – To get a first impression of the possibility of a country or sector momentum component being responsible for the results, we tested the stock momentum strategy country and sector neutral. This implies, that in every country we buy the 20% best performing stocks and sell the 20% percent worst performing stock. In this way the portfolio is well diversified across all countries, and a country momentum component cannot disrupt the results. We also buy in every sector the winners and sell the losers. The results for both the country neutral and the sector neutral strategy are shown in Table 2. The results suggest that both a country momentum and a sector momentum component can partly explain the profitability of a stock momentum strategy based on raw returns, as is performed in most prior research. In a country neutral strategy the performance decreases from 10% per year to about 7%, while in a sector neutral strategy the performance decreases to 8.5%. But the performance is still large and significant, so the sector and country component cannot explain all performance of a raw stock momentum strategy. In the next section we try to determine this country and sector component more precisely by splitting up the raw stock returns in a pure stock, country and sector component.
Pure momentum strategies
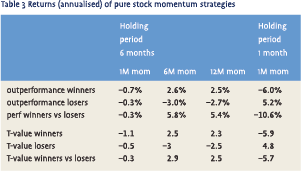 Stock specific momentum – If we filter out the country and sector return components, a global stock momentum strategy is less successful, but there still remains a significant stock specific momentum effect. As can be seen in Table 3, a 6- month momentum strategy, that is based on stock specific returns, generates a return of 5.8% per year. The results of a 12-month momentum strategy are comparable. Both winners and losers contribute to this result. When sector and country return components are filtered out of the returns, the profitability thus decreases from about 10% to less than 6%.
Just as in the case of raw stock returns, the results of a 1-month momentum strategy with a 6- month holding period are insignificant. We also tested the 1-month momentum strategy with a 1-month holding period. These results are more striking: the return of the strategy is significantly negative, with - 10.6% return per year. This result is in line with short term return reversal found by, for example, Jegadeesh (1990) and Lehman (1990). The 1-month reversion effect for individual stocks is often explained by measurement problems due to a bid-ask bounce. But this explanation does not seem probable, because we use a market capitalisation restriction for the stocks in our universe to include only tradable stocks. However due to high transaction costs this strategy will not be very profitable in practice. The explanation for the 1-month reversal for individual stocks might be found in irrational behaviour of investors. In the short term investors overreact to irrelevant news, both good and bad. Because only news that is fundamentally important for earnings growth should effect prices, reversion occurs as soon as investors realise they reacted unjustly. This could result in the price reversion after one month. The momentum effect we find on a longer horizon is caused by fundamental, relevant news. It takes some time before investors realise news is relevant, but as the importance of the fact is discovered after more confirming news, the market’s mindset about the company shifts, causing return continuation. The irrational behaviour of investors can be caused by naive reliance on the biased opinion of analysts (see La Porta (1996) and Dechow and Sloan (1997)).
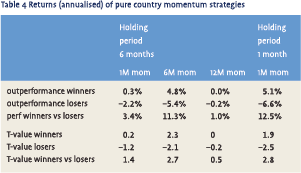 4.2 pure country momentum strategies – The results of a 6-month country momentum strategy are better than the results of a stock specific momentum strategy. Buying winner and selling loser countries generates a significant positive return of 11.3% a year (see Table 4). Both winner and loser countries contribute to the positive return. In contrast to the findings of Asness, Liew & Stevens (1997), a longer momentum strategy (12 months) does not seem to work using pure country returns.
In contrast to the stock momentum results, a 1- month country momentum strategy with a 1-month holding period generates a significant positive return of 12.5%. On an aggregate level, it might be more clear whether information is relevant or not, so that there is no reversion effect in the short term. When macro-economic news about a country is released, which effects all companies in that country, it is easier to determine that it is relevant news. The 1- month return continuation can then be explained by an overreaction of investors to relevant news, just as in the case of longer individual stock momentum. If relevant information about a country can be identified more easily, this can also explain why longer momentum strategies (12 months) don’t work for countries. The return continuation ends sooner because relevant information can be identified easier and the market’s mindset adjusts sooner.
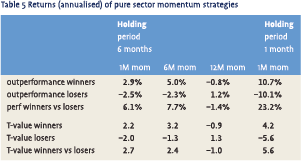 Pure sector momentum strategies – Moskowitz & Grinblatt (1999) find that buying the winning sectors of the last six months and selling the losing sectors produces average monthly profits of 0.43%. Asness, Porter and Stevens (2000) use a longer momentum strategy and find 0.35% performance. These results are similar to our 6-month pure sector momentum strategy, which gives a significant return of 7.7% a year. However, we do not find positive returns for a longer (12-month) momentum strategy and for a shorter (1-month) momentum strategy.
We also tested a 1-month sector momentum strategy with a 1-month holding period. The results are very strong (23.2% per year), just as in the case of a country momentum strategy. The high performance can be mainly explained by the TMT-rally of the last few years, but also before that period the 1-month sector momentum strategy generated a significantly positive return. In the period 1987-1996 the strategy generated 15.6% return per year. So these results are also contrarian to the reversion effect at the stock level. According to Assness, Porter & Stevens the contrarian effect of a market wide 1-month stock momentum strategy can be at least partly explained by a bid-ask bounce, which causes measurement problems. But the strong short-term industry momentum effect appears not due to measurement problems and is real according to their research. As explained, we believe the main explanation for the 1- month reversal effect on a stock level is to be found in investor behaviour. Just as in the case of a country momentum strategy, we believe it is easier to determine for an investor if sector news is relevant or not compared to company specific news. When several companies within a sector release comparable news, the news is probably relevant for the whole sector. Return continuation therefore exists on a very short horizon and ends sooner, as a 12-month momentum strategy even generates a negative return.
Sensitivity analysis – To test for the robustness of the results we performed several sensitivity analyses (results not shown). Both a 6-month and a 12-month stock momentum strategy generate a positive return in all countries and in all sectors, although the results are not significant in every country and sector. Besides, stock, country and sector momentum strategies give about the same results in different subperiods, in both rising and declining stock markets and in both high and low volatility markets. The outcomes therefore suggest performance continuation is not restricted to one or a few countries/sectors, and that it is consistent in different periods and states of the market.
Summary and conclusions
This article showed that a momentum strategy based on pure, i.e. stock specific, returns generates a lower performance than a momentum strategy based on raw returns, but is still significant. This implies that a country and sector component can explain a large part of the success of momentum strategies. If we use the pure country and sector returns we isolated from the raw stock returns, both a country momentum and a sector momentum strategy are very profitable. This implies that the profitability of a stock momentum strategy can be explained by strong momentum in stock specific returns, in country returns and in sector returns. Therefore momentum can be used in the stock, country and sector selection process.
The stock momentum effect is a world wide effect and does not seem to be constrained to one country or one sector, nor does it seem to be caused by higher risk. We believe the cause of the profitability of momentum strategies is to be found in investor behaviour, causing an overreaction in stock prices.
The most important difference between stock specific momentum and country and sector momentum is that a 1-month momentum strategy with a 1- month holding period generates a negative return for stocks, and a positive return for country’s and sectors. We think the explanation can be found in the ability of investors to determine whether news is relevant or not. More in depth research about the difference and speed of the market adjustment after stock specific news as opposed to sector or country news is interesting for future research.
Although the profitability of momentum is inconsistent with the efficient market hypothesis, we believe this anomaly will not disappear in the near future. First of all, momentum is still profitable, despite much research on this subject. Furthermore, as the main explanation can be found in investor psychology, we do not expect investors to change their behaviour suddenly
References
- Asness,C., J. Liew and R. Stevens, 1997, Parallels between the cross-sectional predictability of stock and country returns, Journal of Portfolio Management, pp. 79-87
- Asness, C., R. Porter and R. Stevens, 2000, Predicting stock returns using industry-relative firm characteristics, Working Paper
- Barberis, N., A. Shleifer and R. Vishny, 1998, A model of investor sentiment, Journal of Financial Economics, vol. 49, pp. 307- 343
- Beckers, S., G. Connor and R. Curds, 1996, National versus global influences on equity returns, Financial Analyst Journal, March/April, pp.31-39
- Berk, J. B., R. C. Green and V. Naik, 1999, Optimal investment, growth options, and security returns, Journal of Finance, vol. 54, pp. 1553-1607
- Chan, K, A. Hameed and W. Tong, June 2000, Profitability of momentum strategies in the international capital markets, Journal of Financial and Quantitative Analysis, vol. 35, pp. 153-172
- Dechow, P.M. and R.G. Sloan, 1997, Returns to contrarian investment strategies: tests of naive expectations hypotheses, Journal of Financial Economics, vol. 43, pp. 3-27
- Chan, L., N. Jegadeesh and J. Lakonishok, December 1996, Momentum Strategies, Journal of Finance, vol. 51, pp. 1681- 1713
- Chordia, T. and L. Shivakumar, 2001, Momentum, business cycle and time-varying expected returns, Working Paper
- Conrad, J. and G. Kaul, 1998, An Anatomy of trading strategies, The Review of Financial Studies, vol. 11, pp. 489-519
- Daniel, K., D. Hirshleifer and A. Subrahmanyam, 1998, Investor psychology and security market under- and overreaction, Journal of Finance, vol. 53, pp. 1839-1885
- Grundy, B. D. and J. S. Martin, 2000, Understanding the nature of the risks and the source of the rewards to momentum investing, Review of Financial Studies, vol. 14, pp. 29-78
- Heston, S.L., and K.G. Rouwenhorst, 1995, Industry and country effects in international stock returns, Journal of Portfolio Management, vol. 21, pp. 53-58
- Hong, H. and J. C. Stein, December 1999, A unified theory of underreaction, momentum trading and overreaction in asset markets, Journal of Finance, vol. 54, pp. 2143-2184
- Hong, H. and J. C. Stein, February 2000, Bad news travels slowly: size, analyst coverage and the profitability of momentum strategies, Journal of Finance, vol. 55, pp. 265-295
- Jegadeesh, N., 1990, Evidence of predictable behavior of security returns, Journal of Finance, vol. 45, pp. 881-898
- Jegadeesh, N. and S. Titman, March 1993, Returns to buying winners and selling losers: Implications for stock market efficiency, Journal of Finance, vol. 48, pp. 65-91
- Jegadeesh, N. and S. Titman, 2001, Profitability of momentum strategies: an evaluation of alternative explanations, Journal of Finance, vol. 56, pp. 699-720
- La Porta, R., December 1996, Expectations and the cross-section of stock returns, Journal of Finance, vol. 51, pp. 1715-1742
- Lehman, B.N., 1990, Fads, martingales and market efficiency, Quarterly Journal of Economics, vol. 105, pp. 1-28
- Moskowitz, T.J. and M. Grinblatt, August 1999, Do industries explain momentum?, Journal of Finance, vol. 54, pp. 1249- 1290
- O’Neal, E.S., July/August 2000, Industry momentum and sector mutual funds, Financial Analyst Journal, vol. 56, pp. 37- 49
- Richards, A.J., 1996, Winner-loser reversals in national stock market indices: Can they be explained?, Journal of Finance, vol. 52, pp. 2129-2144
- Rouwenhorst, K.G., February 1998, International momentum strategies, Journal of Finance, vol. 53, pp. 267-284
Notes
- For companies that are not in the MSCI-universe, we use the Factset sector classification, to determine to which MSCI-sector the company belongs.
- We start by constructing a portfolio at the beginning of month 1 and we hold the portfolio for six months. In the next month we construct another portfolio and also hold this portfolio for six months. The performance in month 2 is the average performance of the two portfolios constructed at the beginning of respectively month 1 and 2. In month we construct the third portfolio and so on. After six months we have constructed six portfolios and we calculate the average performance of these six portfolios. At the beginning of the 7th month the first portfolio will be sold and we construct a new portfolio. In this way we always hold six portfolios at the same time. We note that this method should not be seen as a realistic implementation of a stock selection strategy or country/sector allocation, but as a method to make as much use as possible of the monthly data with a 6-month holding period.
in VBA Journaal door Anita JoostenHendriks, Judit Vennix