
INTRODUCTION
Investors have increased attention to sustainable investment in the past decade. The Global Sustainable Investment Review 2020 shows that more than USD 35 trillion are invested in sustainable assets globally. According to the report, sustainably managed assets have grown 55% relative to 2016. The high allocation toward sustainable investments suggests that investors have increasing preference for sustainable assets.
 Sustainability issues have received high attention in the finance literature. The literature has been using different terminologies to describe sustainability issues, such as “environmental, social and governance” (ESG), “sustainability”, “green assets”, or “corporate social responsibility” (CSR). We use these terminologies interchangeably in this study because they reflect similar meaning and describe firm’s activity that can give positive impact for the environment and society
While there is a significant increase in assets allocated to sustainable investment, many studies show mixed results about the impact of sustainability considerations on portfolio performance. Some studies suggest that trading strategies that take long (short) positions in firms with high (low) sustainability scores generate positive returns. For example, Khan et al. (2016) use material sustainability issues as a proxy for firm’s sustainability and show that firms with good sustainability ratings have better performance than firms with bad sustainability ratings. Berg et al. (2022) studies how changes in sustainability scores affect stock returns. They find that downgrades have a negative impact on firms’ performance and upgrades have opposite but weaker effects. Galema and Gerritsen (2022) show that sustainability score downgrades lead to negative abnormal returns and increased systematic risks. Edmans (2011) suggests that firms with high employee satisfaction outperform firms with low employee satisfaction. On the other hand, Bolton and Kacperczyk (2021) show that investors demand compensation to hold assets with high carbon emission risk, hence, firms with higher CO2 emissions have higher expected returns. Furthermore, Hong and Kacperczyk (2009) suggest that sin stocks, e.g., stocks of companies that produce alcohol, tobacco, and gaming, have higher expected returns.
Pedersen et al. (2021) theoretically shows that the relationship between sustainability and stock returns can be positive, neutral, or negative. In their theoretical model, some investors focus on their portfolio mean-variance of returns, while other investors have a high preference for stocks with high sustainability scores and optimize their portfolio based on expected return, risk, and sustainability scores. Their model suggests that sustainability can predict stock returns if sustainability is a strong predictor for a firm’s future profits and the market has not fully appreciated this sustainability value. The positive relationship between sustainability and stock returns can become negative if investors fully price the value in sustainability, hence they accept lower expected returns for stocks with high sustainability scores.
A recent study by Alves et al. (2022) comprehensively analyses on the one hand ESG scores of three leading providers (MSCI, Sustainalytics and Refinitiv), as well as their sub-ratings (E, S or G) and changes in their level, and on the other hand stock returns. They find “very little evidence” of a relationship between them, both globally as well as by region and sector. What they do show is that there is little correspondence between the ESG ratings of the different providers and even high disagreement in emerging economies. Even worse for ESG ratings, Bams et al. (2022) find that investors’ ability to invest responsibly is hindered by information asymmetry. By tilting portfolios based on inflated ESG ratings, socially responsible investors may increase the capital cost of sustainable firms. Given these deficiencies of ESG ratings, for our sustainable investing we take a different approach. We start from the belief that the key to true sustainable investment is how a company deals with its stakeholders. Companies have many stakeholders that can affect or be affected by the firm. Stakeholders include investors, board members, customers, employees, suppliers, society and communities, and natural environment. We believe companies that are run with consideration for all their stakeholders can deliver better long-term results and are less likely to experience severe or existential controversies. Thus, these kinds of companies will not only aim to maximize their shareholder returns, but also aim to maximize “long term stakeholder value” (LTSV). Our belief is similar to Edmans (2023), who argues that sustainability factors affect a company’s valuation in the same way as other intangible assets, i.e., through their impact on the company’s long-term value. Factors such as corporate culture and innovative capability are difficult to measure and may not be fully incorporated in price, but he argues it pays to analyze such long-term factors when valuing a company to beat the market. To identify firms that maximize LTSV, we therefore need drivers that have forward looking elements.
This paper uses one such driver, green innovation as a proxy for a firm’s engagement in sustainability activities and examines whether firms with high green innovation scores outperform firms with low green innovation scores. We define green innovation as a firm’s green patents compared to its total patents, granted over the last three years. Hirshleifer et al. (2017) show that investors tend to undervalue innovative firms because investors have limited attention and over-discount the innovative firm’s prospects due to its high uncertainty and complexity. Furthermore, several reasons contribute to explain why green innovation can help firms to develop competitive advantages and realize favorable long-term performance. Consumers are becoming more aware of the potential environmental impact of their purchasing decisions. Literature (Kishore Babu et al., 2018) shows that despite consumer decisions are influenced by numerous factors, there is a dramatic increase in the consumption of eco-friendly products. The shifting preference of consumers to buy sustainable products is beneficial to companies that are strong in offering these products. In addition, companies with an innovative green proposition can be in a better position to attract and retain talent by instilling a sense of purpose, enhancing employee motivation and improving employee satisfaction. This may have implications for the capital market as Edmans (2001) establishes a positive relationship between employee satisfaction and stock returns. In a world of rising concern towards climate change, companies with a strong green proposition may have stronger fundamental performances compared to firms with a weak green proposition.
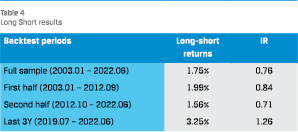
The main result of this paper is that a trading strategy of buying firms with high green innovation and selling firms with low green innovation generates value weighted returns of 1.75% per year, with an annualized IR of 0.76, from January 2003 to June 2022. Furthermore, the returns from green innovation cannot be fully explained by standard factors, such as market beta, book-toprice, size, investment, profitability, and momentum. After controlling for these factors, the alpha of green innovation is unchanged at 1.8% per year and statistically significant at the 1% level. We further examine if firms with high green innovation are likely to be more profitable in the future. Using regression analysis, we show that green innovation predicts future firm profitability. The green innovation score has a statistically significant positive relationship with the next twelve months return on assets. Thus, our findings are consistent with Pedersen et al. (2021), green innovation predicts stock returns because the market does not fully appreciate the future prospects of green innovative firms, which tend to have unexpected high future profitability. This analysis, however, is limited to understand the relationship between green innovation and firm’s profitability which is observable. We believe that green innovative firms have high intangible value which is difficult to quantify
This paper contributes to the literature by showing empirically that we can find a trading strategy that generates alpha while simultaneously tilting our portfolio towards sustainable firms using their green innovation scores. Unlike many standard ESG ratings that are typically backward looking, our green innovation score is a forward-looking metric in the sense that it can predict future stock returns and firm fundamentals while simultaneously contribute to “long term stakeholder value”.
IDENTIFYING GREEN INNOVATION
 To measure green innovation, we use a US patent dataset originally sourced from the United States Patent and Trademark Office (USPTO). The patent dataset records historically granted patents and technical areas to which they pertain. Patents have long been known as an indicator of innovation productivity. Academic literature provides evidence that innovation proxied by various measures constructed from patent data is a strong positive predictor of future stock returns, even after controlling for firm characteristics and risk (Hirshleifer, et al (2013); Hirshleifer, et al (2018); Lee, et al (2017)). One major advantage of measuring green innovation based on patents is that they are classified by professional patent examiners. Each patent publication is assigned to classification terms indicating the subjects to which the invention relates, providing us a starting ground to identify patents that are related to green technologies.
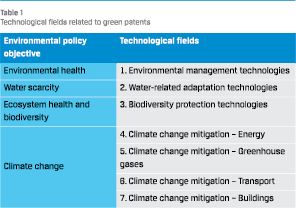
Haščič and Migotto (2015) develop a search strategy to select classification terms related to different green technological fields. The primary classification schema adopted in their paper is the Cooperative Patent Classification (CPC) system. The CPC system has been jointly developed and maintained by the European Patent Office (EPO) and USPTO, and it has been widely used by many patent offices across the world. Haščič and Migotto (2015) group selected CPC codes into four categories according to their environmental objectives. The four objectives consist of seven technological fields as presented in Table 1.
Technological fields encompass patenting activities related to environmental management, water related adaptation technologies, biodiversity protection and ecosystem health, and climate change mitigation technologies. Their applications can be broad, for example, the technological field of environment management covers patents related to pollution abatement, such as emission reduction from combustion plants and vehicles, waste water treatment and material recycling/re-use. The Climate change mitigation – Greenhouse gases technological field consists of technologies that contribute to capture or dispose carbon dioxide and other greenhouse gases through various means, like absorption, biological separation, membranes or diffusion. One of the biggest technological fields is Climate change mitigation – Energy. Its applications include renewable energy generation technologies, such as wind energy, solar energy, geothermal energy, marine energy and hydro energy, as well as technologies related to efficient use and storage of energy.
DATA AND SUMMARY STATISTICS
 This study is based on United States patents from January 2000 to June 2022. The dataset includes variables like patent grant dates, the point-in-time ultimate owner(s) of the granted patents, patent classification codes, outward and inward patent citations and corresponding citation dates. By assigning patents to their point-in-time owners, we avoid look-ahead bias when performing analysis and make sure the backtest results are not compromised. It is worth noting that patents can be re-assigned to another owner from the initial owner, either through selling of a patent or merger and acquisition activities. In case of a patent re-assignment, we exclude the patent from the second owner’s patent portfolio. By restricting attention only to the organic innovation of a firm, we measure a firm’s own internal innovation ability
GREEN INNOVATIVE FIRMS CREATE LONGTERM STAKEHOLDER VALUE
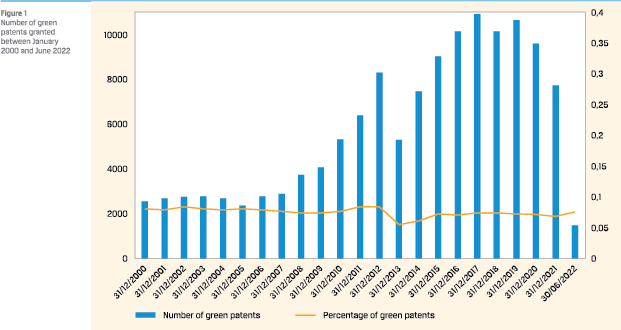
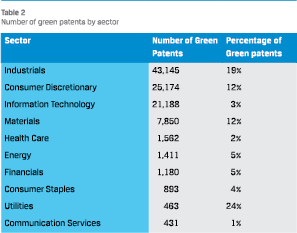 Figure 1 shows the number of new green patents granted and the percentage of green patents compared to all patents on a yearly basis, from January 2000 to June 2022. The aggregate number of green patents has been growing rapidly before 2019.2 Starting from about two thousand patents in 2000, the total number of granted green patents reached a peak of more than ten thousand in 2017. The percentage of green patents also steadily increased from 5.4% to 7.6% between 2013 and 2019. The growth in green patents is mainly driven by the increased number of patent applications, accompanied by a higher percentage of green patents that may result from an increasing awareness of sustainable development and green technologies. However, in recent years, the number of green patents has gradually declined. The drop might be caused by the outbreak of COVID-19. The pandemic could lead to adjustments in innovation budgets, reduced availability of staff and longer patent grant periods. Typically, it takes two to three years between patent application and grant, hence the impact of COVID-19 may be revealed with a lag and continues to 2022.
The number and percentage of green patents in different sectors aggregated over the whole sample period are shown in Table 2. The distribution shows a clear sector dispersion. The top sectors, Industrials, Consumer Discretionary and Information Technology together own nearly 90% of granted green patents. This is possibly due to the fact that the added value from green innovation is potentially very different across sectors. Some sectors may have more market opportunities than others. For example, high-carbon businesses face larger costs and slowing demand because of carbon taxes, restrictions on emissions, or disruption from lower-carbon alternatives.
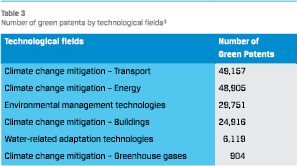 Table 3 presents the number of green patents belonging to each technological field. Note that a patent can be in more than one technological field. For example, if a technology is related to solar photovoltaic electricity generation for buildings, it is counted both in Climate change mitigation – Energy and Climate change mitigation – Buildings. It is not surprising to see many green patents are either related to Energy or Transport. Renewable energy has become increasingly important and received more and more attention as traditional energy such as oil and gas are large contributors to climate change, and electric vehicles are considered as more sustainable and environmentally friendly alternative to conventional vehicles.
One example of a company with a high green innovation score in our sample is Enphase Energy, Inc., which is a technology company that focuses on solar energy. Their products include solar microinverter technology and smart battery technology. This company has been producing more than 10 green patents per year from 2016 to 2022. Furthermore, the company enjoyed a significant business growth, indicated by 45% annual increase of revenue from 2016 to 2022.
ANALYSIS AND RESULTS
The green innovation score is defined as the number of green patents that a firm generates in a rolling window of three years, divided by the number of total patents plus one during the same period, as shown in Equation (1). That gives us a sense of how much green innovation a company has produced recently relative to its total innovation. The motivation to add a plus one in the denominator is to scale down the signal when a firm’s patent portfolio is small. A firm with one hundred green patents out of one hundred patents is probably more committed to green innovation than a firm with one green patent out of a sole-patent portfolio. Our definition assigns a score of 0.99 to the former and 0.5 to the latter, accounting for their respective patent portfolio sizes.

At each month, we construct a portfolio that takes long positions in stocks with green innovation score higher than its median and short positions in stocks with green innovation score lower than its median. To avoid results that are driven by small stocks, we use square root of market capitalization as the weight in our long short analysis. The backtest period is from January 2003 to June 2022. While the patent data starts from January 2000, our backtest period starts three years later because we want to use this period to construct the signal. The investment universe includes constituents of the MSCI USA investable market index. There are on average 1,054 stocks with a green innovation score each month.
 We correct the green innovation score for market beta, size, and industries. We control for industries to avoid the situation that the returns could come from industry allocation. Following Hong et al. (2000), we run a cross sectional regression at each month to remove the influence of market beta, size, and industries, from the green intensity score. Then, we use the residual of the regression as the signal for the long short analysis. The signal has a low decay which is indicated by the high correlation between the signal and its own 12 month lagged value. The time series average of the cross-sectional correlation between the signal and its own 12 month lagged value is 0.82.
The green innovation score yields monthly calendar time portfolio long short returns of 1.75% per year with annualized IR of 0.76 for the full sample. The portfolio performance in the recent period is stronger than that of full sample. In the last three years from July 2019 to June 2022, the portfolio has annualized returns of 3.25% with an IR of 1.26. The long short returns are relatively stable over time. The portfolio return is 1.99% (1.56%) per year in the first half (second half) of the sample.
We use Brinson attribution to understand if the long short performance comes from allocation or selection effect. Controlling the green intensity for industries during the signal construction makes the long-short performance mostly comes from selection effect (1.49%), instead of allocation effect (0.26%). However, the signal has different selection effects across different sectors. The signal is particularly good within Information Technology, Consumer Discretionary, and Energy with selection effects of 0.73% (IR 0.61), 0.24% (IR 0.30), and 0.20% (IR 0.32). On the other hand, the selection effect is weak within Utilities and Health Care. Industrials sector, which has the highest number of green patents, has a selection effect of 0.12% (IR 0.14).
GREEN PATENT-BASED INVESTMENT SIGNAL GENERATES IDIOSYNCRATIC EXCESS RETURNS
To further examine if the green innovation portfolio returns can be explained by some well-known risk factor returns in a time series setting, we run the regression analysis as shown in Equation (2), where Rt is the green innovation long-short return in month t. MKTt is market return. The risk factor return variables are defined as factor return per unit of exposure to the respective firm characteristic. BooktoPricet corresponds to a firm’s book value of equity scaled by market capitalization, Sizet to log of firm’s market capitalization, Investmentt to firm’s investment including asset growth, Profitabilityt to firm’s profitability including gross profitability, Momentumt to stock momentum anomaly. Furthermore, we also control for ESGt , which is a factor return per unit exposure to a firm’s overall industryadjusted ESG rating. The aforementioned risk factors and ESG ratings are sourced from MSCI.

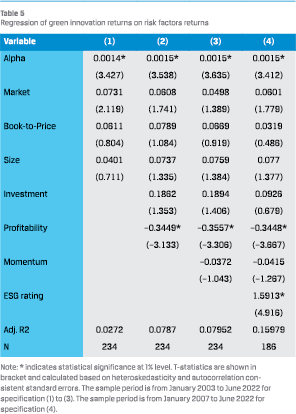 Table 5 reports the result of contemporaneously regressing monthly calendar time green innovation portfolio returns on widely-known risk factor and ESG rating returns. The regression shows that commonly known risk factor returns cannot fully explain green innovation returns. Furthermore, green innovation earns a statistically significant alpha at 1% level across four different specifications. The annualized alpha is economically significant at between 1.7% and 1.8%. It is interesting to see that ESG rating returns have a statistically significant positive relationship with green innovation returns in specification (4). However, even after controlling for ESG rating returns, the alpha of the green innovation score is still economically and statistically significant.
In the previous analysis, we showed that the green innovation predicts future stock returns. Pedersen et al. (2021) theoretically show that a necessary condition for ESG type information to be able to predict stock returns is that the ESG information should be able to predict future firm fundamentals. In this study, we use return on asset (ROA) as the firm fundamentals. We run a pooled regression analysis using monthly observations as shown in Equation (3) and report the t-statistics that are calculated based on stock and monthly clustered standard errors. The dependent variable is ROA measured within 12 month after the calculation of the green innovation score. We also add several firm characteristics as control variables. We winsorize all variables at the 1% and 99% level. From the analysis, we are interested to see if green innovation can predict future ROA.

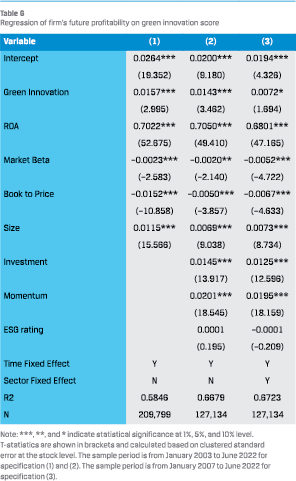 Table 6 shows that the coefficients of green innovation are statistically significant across three different specifications. In terms of economic significance, an increase in green innovation score by one standard deviation leads to an increase in the next twelve months ROA by 0.2% in specification (1). The regression results suggest that green innovation firms have stronger future fundamentals which are not fully priced by the market. On the other hand, commonly used ESG rating cannot predict future ROA as shown in specification (3), hence the ESG rating is not forward looking in terms of firm’s performance. Adding a sector fixed effect reduces the coefficient of green innovation, but it is still statistically significant at the 10% level.
CONCLUSION
There is a significant and growing attention from investors towards sustainable investing. However, previous studies show mixed results whether incorporating sustainability drivers improve or deteriorate portfolio performance. The journey to find alpha drivers that also promote sustainable firms is challenging. However, it is possible to find sustainable alpha drivers that predict stock returns if we diligently search for places where investors are unlikely to be paying full attention or investors experience difficulty processing complex information, for example gaining insights from patent data.
In this paper, we show that a green innovation driver constructed from patent data can generate returns that are not fully explained by standard risk factors, such as market beta, book to price, size, investment, profitability, and momentum. After controlling for the standard risk factors, the green innovation long short strategy yields 1.8% annualized alpha. We further examine if the green innovation driver can predict future firm fundamentals and show that it predicts the next 12 months return on assets. Consistent with Pedersen et al. (2021), the market does not fully appreciate green innovation, explaining why it can predict future stock returns.
THE MARKET HAS NOT FULLY APPRECIATED GREEN INNOVATIVE FIRMS’ PROSPECTS
The results of this paper help the ambition to deliver a truly sustainable excess return stream, based on both financial as well as non-financial criteria. The green innovation drivers constructed from patent data can facilitate a closer alignment between business and desirable outcomes for all stakeholders, not only shareholders. The green innovation signal typically selects companies that have a long-term view on performance and are managed to maximize the long-term interests of all stakeholders. These companies constructively manage the risks of negative externalities and have an improved ability to identify and access environmental and social opportunities. Our green innovation research is one example of how to identify companies with intellectual property in emerging technologies that provide innovative solutions to combat the world’s biggest challenges such as climate change and water scarcity. Its results support the belief that it is possible to achieve excess financial returns while accounting for investors’ sustainability preferences. Future research should further examine on finding similar drivers that not only generate returns but also contribute to long-term stakeholder value.
Reference
- Alves, R., Krüger, P. and van Dijk, M., [2022]. Drawing Up the Bill: Does Sustainable Investing Affect Stock Returns Around the World? Netspar, Network for Studies on Pensions, Aging and Retirement.
- Bams, D. and van der Kroft, B., [2022]. Tilting the Wrong Firms? How Inflated ESG Ratings Negate Socially Responsible Investing under Information Asymmetries. MIT Center for Real Estate Research Paper 22/12.
- Berg, F. Heeb, F. and Kölbel, J., [2022], The Economic Impact of ESG Ratings.
- Edmans, A., [2011]. Does the stock market fully value intangibles? Employee satisfaction and equity prices. Journal of Financial Economics.
- Edmans, A., [2023], The End of ESG. Financial Management.
- Galema, R. and Gerritsen, D., [2023], ESG Rating Score Revisions and Stock Returns.
- Haščič, I. and Migotto, M., [2015]. Measuring environmental innovation using patent data. OECD Environment Working Papers.
- Hirshleifer, D., Hsu, P. and Li, D. [2013]. Innovative Efficiency and Stock Returns, Journal of Financial Economics.
- Hirshleifer, D., Hsu, P. and Li, D. [2018]. Innovative Originality, Profitability, and Stock Returns, Review of Financial Studies.
- Hong, H. and Kacperczyk, M. [2009]. The price of sin: The effects of social norms on markets, Journal of Financial Economics.
- Hong, H., Lim, T. and Stein, J. C. [2000]. Bad News Travels Slowly: Size, Analyst Coverage, and the Profitability of Momentum Strategies, Journal of Finance.
- Khan, M., Serafeim, G. and Yoon, A. [2016]. Corporate Sustainability: First Evidence on Materiality, Accounting Review.
- Kishore Babu, B., Rajeswari, N. and Mounika, N. [2018]. An Empirical Study on Consumer Green Buying Behaviour, Vijayawada, Andhra Pradesh.
- Lee, M. C., Sun, S. T., Wang, R. and Zhang, R. [2017]. Technological Links and Predictable Returns, Journal of Financial Economics.
- Pedersen, L. H., Fitzgibbons, S. and Pomorski, L. [2021]. Responsible investing: The ESG-efficient frontier, Journal of Financial Economics.
Notes
- All authors are at APG Asset Management. The views and analysis expressed in this article are those of the authors and do not necessarily represent the view of APG Asset Management. We thank the VBA editorial team, Dirk Gerritsen and Frederik Mannaerts, for their comments and feedback.
- The CPC schema used to identify green patents was introduced in 2013. Before 2013, only United States Patent Classification (USPC) codes are available. A statistical mapping between USPC and CPC is used to infer green patents granted and percentage of green patents before 2013.
- There are no Biodiversity protection technologies because a corresponding search strategy is currently not yet available according to Haščič and Migotto (2015). They argue that some of the technologies that are already included contribute also to improving ecosystem health (e.g., water and wastewater treatment).
in VBA Journaal door Gijsbert de Lange, Maarten Smit, Hendro Sugandi, and Yajie Sun