
Introduction
Longevity risk has jumped to the forefront of pension risk management in recent years, as changing actuarial assumptions and low interest rates have placed additional stress on the funding ratios of pension plans. For a pension fund, longevity risk is the risk that participants in the fund will live longer than currently expected, and that future pension payments will therefore continue longer than expected.
Over the last few years, hedging instruments have been developed in order to help pension funds to protect themselves against longevity risk. The UK market for longevity protection, in particular, has been quite active. In the Netherlands, longevity risk helped trigger a discussion on the sustainability of the pension system that led to a raise in the official retirement age and the introduction of measures that allow the adjustment of accrued pension rights in accordance with updated mortality figures.
This paper discusses the effectiveness of longevity risk hedging for pension funds. We provide a case study of a fictitious Dutch pension fund entering into a longevity swap in 2006. We then assess the effectiveness of that longevity hedge after 4 years (2010). For the sake of simplicity, we assume that the mortality model used by the fund is the same as the model used to value the longevity swap (although in practice, this is often not the case). Other relevant aspects of hedging longevity risk, like liquidity and counterparty risk, are also beyond the scope of this paper.
By providing a detailed case study of longevity risk management in action, we hope to assist pension funds to gain a better understanding of longevity risk management and longevity risk protection.
 Mortality modeling
The model used in this paper takes into account three sources of longevity risk for a pension plan in the Netherlands.
- The first source of risk comes from the development of future national mortality rates. Over the last century and a half, mortality rates have declined for all ages, both male and female.But the level of decline has not been stable from decade to decade, due to, for example, developments in medical science, changing habits like drinking alcohol or smoking, etc. The most recent mortality data show a strong improvement in mortality rates, which means that people are living longer, which in turn hurts the financial position of pension funds. Historical mortality rates for each gender and age group have been shown to be log-linear over time2 and several mortality models3 are based on this phenomenon. The model4 used in this paper also assumes log-linearity of national mortality rates, allowing for diversification between different age groups and between males and females. To incorporate the recent improvement in mortality rates, the model is estimated on 10 years of data for trend risk, while volatility analysis is based on a broader window. In addition, in order to create a coherent framework, we impose that expected mortality rates for older ages are higher than for younger ages and expected mortality rates for males are higher than for females in each simulation.
For each valuation, we create 10,000 possible future scenarios for mortality rates for each gender and each age.
- The second source of risk is related to the difference in mortality rates between the overall Dutch population and the fund-specific population. This is also called experience assessment error. To model this source of risk, we assumed that the mortality rates for the pension fund equal the population rates adjusted for a gender and age specific scalar.5 To estimate this scalar, historical population and mortality experience for the fund were used. Experience factors were assessed with confidence intervals such that the stochastic simulations also reflect uncertainty in experience.
- The third and final source of risk comes from random fluctuations. Even if the mortality rate of a certain individual is perfectly known, whether or not this person dies is a matter of chance. This source of risk is more important for small pension funds and funds with pronounced benefit distributions (for example, a small company with 250 low-income employees and one high-income director). To model this source of risk, cash flow scenarios are created on the basis of random ‘behaviour’ (dying or not dying) of every single individual through time, as determined by the applicable mortality rates. Thus the model resembles real life without undue simplifications.
For each valuation, we create 10,000 possible future scenarios for mortality rates for each gender and each age. In other words, we create a scenario set of 10,000 generational mortality tables, including experience assessment error. Combined with the characteristics of all individual pension fund members as of the valuation dates, this gives us the range of outcomes of future pension payments (cash flow patterns). In other words, we can show a full range of outcomes for a specific pension fund.
Together they comprise the pension plan risk profile with respect to longevity risk.
Longevity risk
To view longevity risk at different points in time, we begin with 2006. Using the model outlined in the paragraph before, this paragraph explores longevity risk in 2006 for a fictitious Dutch pension fund that is closed for future accrual. We assume that all liabilities are nominal.
 Table 1 shows some characteristics of the range of future outcomes: The expected future cash flows, termed the Best Estimate, have a present value of €5,000mn. The next columns show the upper and lower bounds of confidence interval. While currently we may expect the total value of cash flows to amount to €5,000mn, it may also come out at €5,276mn (97.5th -percentile) or even at €5,332mn (99.5th-percentile).
Longevity protection
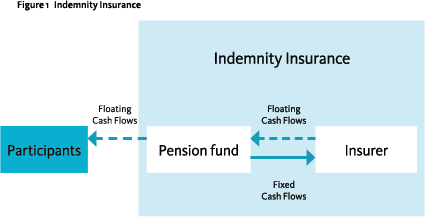 There are several ways to hedge longevity risk for a pension fund. In this article, we will focus on the use of so called “indemnity insurance.” As illustrated in Figure 1, indemnity insurance consists of the exchange of cash flows based on actual plan benefits and actual plan mortality experience. The pension fund agrees with the counterparty to pay a fixed (predetermined) cash flow every year, which is equal to the expected cash flow as determined at the start of the contract plus a risk premium. This is called the “fixed leg:”

Fixed Leg (FL) = Best Estimate (BE) + Risk Premium (RP)
In turn, the counterparty agrees to pay a floating cash flow, which depends on the actual mortality experienced in the fund. If mortality is lower than expected, the counterparty will pay a higher cash flow to the fund. This will offset the higher pension benefits that the fund will have to pay to its pensioners. As a result of the insurance, the pension
The Risk Premium is 2.7% of reserves
fund knows in advance the future cost of pension benefits, and has transferred longevity risk to the provider of the contract.
The Best Estimate is the average cash flow profile derived from the model based on 10,000 simulations. The Risk Premium depends on the (longevity) risk around this Best Estimate.6
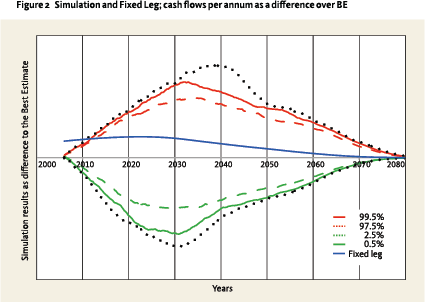 Figure 2 shows the variability in future cash flow patterns versus the Best Estimate due to longevity risk. The red and green full lines show the 0.5% and 99.5% percentiles of the pay-outs to pensioners, while the dotted lines show the 2.5% and 97.5% percentiles. The black dotted lines show the minimum and maximum cash flows seen in the simulations. The figure also shows the fixed leg for this contract, which is defined (as well as the percentiles), as a differential over the Best Estimate. Over the first years, the fixed leg of the contract will be higher than the pay-outs to the pensioners under any mortality scenario. This is due to the Risk Premium. When mortality rates decrease more than expected, actual pension payments will rise above the fixed leg over time.
The last column of table 1 shows the cost of the indemnity contract. While the Best Estimate of future cash flows (reserve) is €5,000mn, the Fixed Leg comes in at €5,135mn. The Risk Premium is therefore €135mn, or 2.7% of reserves. This is the cost of protecting the pension fund from mortality improvements, which could cause a rise in liability value to €5,276mn (97.5th -percentile) or even €5,332mn (99.5th-percentile). With the insurance, the outcome is effectively fixed at €5,135mn.
Evaluating the effectiveness of indemnity insurance
What would have happened if the pension fund had entered into an indemnity contract in 2006? How effective would the contract have been? Would the price have been reasonable in hindsight? How should this be measured? To answer those questions, this paragraph will evaluate the contract over the period 2006-2010.
 Table 2 compares valuations in 2006 and 2010:
- The Best Estimate of future cash flows in 2006 was €5,000mn, while the Fixed Leg of a swap at that time would have been €5,135mn. This is a risk premium of €135mn, or 2.7%.7
- Under the 2006 projection, the Best Estimate of Cash Flows in 2010 is equal to €4,624mn. This is lower than €5,000mn due to the fact that 4 years of payments have already been made. Also, interest rates have changed over time, which impacts the present value of future cash flows.
- However, if we update the cash flow projections based on mortality data up to 2010, the model results in a Best Estimate of €4,696mn, an increase of €72mn over the 2006 view.
- The value of the hedge in 2010 is the difference between the Fixed Leg of the 2006 hedge and the Fixed Leg of the 2010 hedge. The value of the swap in 2010 is €67mn.
Over the 4-year period, mortality rates have come down more than was expected in 2006. As a consequence, the value of the liabilities of the fund has increased by €72mn, on a like- for-like basis. This equals 1.5% of the fund value. Compared to the impact of the AG table update in 2010, which added 6-8% to reserves on average, 1.5% looks like an underestimation. However, it is important to note that the AG2010 update included not only changes due to observed mortality, but also a new approach to modelling future mortality.
The hedge that was acquired in 2006 started with a value of €0. In 2010, this hedge would have had a value of €67mn. This compensates the increase in liabilities due to mortality improvements.8 The total
The fund would have recouped half of the risk premium in the first 4 years
cost of the longevity insurance for the pension fund over the first four years consists of the net payments to the counterparty minus the increase in the value of the insurance contract. When viewing the fixed minus floating legs for the first four years, the fund was a net payer, paying roughly €19mn in premium over the first four years. However, this would have been more than compensated for by the increase in the value of the insurance contract of €67mn.
The total price for the protection is €135mn, and it is important to note that this protection exists until the end of the life of the fund, in some 60 or 70 years. 4 years after inception, the value of the swap is €67mn. So, after 4 years, half of the price of the protection would have been recouped.
Summary and conclusions
Longevity risk is the risk that people live longer than currently expected. To understand longevity risk and to value longevity products, stochastic models are an important tool. In this paper we have used a stochastic mortality model to analyse the impact of changing mortality projections over a 4-year period, from 2006 to 2010. The impact of changing mortality projections over this period was significant and an indemnity hedge would have provided effective protection. However, protecting against longevity risk comes at a price. In this case study, the fund would have had to pay 2.7% of its liability value. Whether or not a fund wishes to pay such a price for the protection it receives will vary from case to case. In this case study, the fund would have recouped half of the risk premium in the first 4 years. But more importantly, the hedge provides increased certainty on pension payments into the future.
The analysis in this paper was based on a hypothetical case, as the market for longevity protection was immature in 2006. However, the analysis provides useful insights into how a pension fund could measure and hedge longevity risk.
Currently, Dutch pension funds are going through a period of transition. Although there is still considerable uncertainty about the current wave of pension reforms, it is already clear that changes in life expectancy are an important element of those reforms. In order to be able to evaluate the impact of present proposed reforms, pension funds will require a good understanding of longevity risk – and by investigating ways to deal with this risk now will help funds to take action once the dust settles from the latest pension reforms.
Notes
- Judit, Anita and Frans work at Stichting Philips Pensioenfonds, Martijn works at AEGON Global Pensions, and Chris and Sylvain work at AEGON N.V. This article expresses the personal opinion of the authors.
- Madsen, C. and M. Tans (2011). Longevity and Pensions: Protecting company pensions against increasing longevity. AEGON Global Pensions publication.
- Li, J.S. and M.R. Hardy (2011). Measuring basis risk in longevity hedges. North American Actuarial Journal, Volume 15, number 2
- qa,t,g = e Aa,g+Ba,g,t + į t = 0įa,s,g , where qa,t,g is the mortality rate of the Dutch population for gender g, age a at time t, A is a level parameter, B is a trend parameter B and e is a multi-dimensional error term Ƥ İt ~ N ( 0,), where Ƨ is the covariance matrix
- a,t,g = qa,t,g . a,g,t p p , where qp is the mortality rate for the pension fund and fp is a gender g specific scalar for age a at time t N p t ~ (µ p , į p2) - a normal distribution is generally sufficient for lower variations, though a log-normal could also be used but in our experience will yield mostly similar results.
- The risk premium is calculated as the cost of the capital that the counterparty will have to add to its reserves for taking this risk onto its balance sheet.
- This will fluctuate with assumed interest rates, cost of capital and diversification on any given insurer’s balance sheet.
- Although the indemnity contract is designed to track the cash flows, and hence the valuation, of the fund 1-for-1, the swap valuation is also partly determined by the Risk Premium. As volatility has increased over the last 4 years, the Risk Premium has increased as well, which has a positive effect on the value of the swap.
in VBA Journaal door Judit Vennix, Anita Joosten, Frans Claes, Martijn Tans, Chris Madsen, Sylvain de Crom