
 Introduction
The use of insider knowledge in financial markets is illegal. Market participants should only deal on publicly available information, so that a level playing field is created for all. Otherwise, public confidence in financial markets would be undermined. To improve market transparency, the disclosure of insider trading has been required in the United States since 1934 and in the United Kingdom since 1976. However, in the Netherlands, similar legislation was introduced much more recently. Although the use of insider knowledge has been illegal since 1989, disclosure of insider trading has been required only since April 1999. In September 2002, the disclosure requirement was extended to insiders’ total holdings in their company, and to trades initiated by their asset managers on their behalf.
Abnormal returns for insiders based on the abuse of insider knowledge or a better understanding of public information are also related to the efficiency of the market. If insider trades provide valuable information for investors, prices should react immediatey to their disclosure. If there is no immediate adjustment to new information, a trading strategy based on insider trading could represent an interesting opportunity for investors.
The public availability of insider trade data for the Dutch market enables us to examine the profitability of insider trading with fresh data for a new market. In this study we examine the price pattern around insider trades for the period April 1999 to May 2002. We correct for possible size and value/growth effects in our sample. We focus on transactions by management, executive and non-executive directors and members of a company’s supervisory board. In the remainder of the article, we review the literature on insider trading, discuss our data and methodology, and present our empirical results. The article ends with a summary and our conclusions.

Review of literature
Most research demonstrates the informative value of insider trades in the US market. Seyhun (1998) examined the American market thoroughly. With insider trade data covering the period from 1975 to 1995 for the New York Stock Exchange (NYSE), the Nasdaq and the American Stock Exchange (AMEX), a data set with more than 300,000 insider transaction months is compiled, in which a purchase (sale) month for a stock is defined as a month with net insider buying (selling). In the 12 months after a purchase month he reports an average outperformance of 4.5%, while sale months generate an average underperformance of 2.7%. Two-thirds of the outperformance is realized in the first 6 months. In the 12 months before the insider activity there appears to be an underperformance for purchasing months of 2.5% and an outperformance for sale months of 16.0% with most of the outperformance in the three months before the insider activity. So, just around the transaction month there is a spike in the average performance pattern.
A cross-section regression analysis subsequently reveals a link between several transaction characteristics and the size of the relative performance. The transaction volume and the insider’s position within the firm are positively correlated to the relative performance. There is a negative correlation between market capitalization and relative performance. According to Seyhun (1998) this could be due to more efficient pricing for large firms, since they are more extensively covered by analysts. Finally, Seyhun (1988) shows that net aggregate insider trading activity in a given month is significantly positively correlated with the market’s return during the subsequent 2 months. However, the predictability of market returns cannot be used for a switching strategy between bonds and stocks, since on average the market return in a month with net selling still exceeds the risk-free rate.
Jeng, Metrick and Zeckhauser (1999) examine a sample for the United States ranging from 1975 to 1996. They construct purchase and sale portfolios with holding periods of 6 months. Insider transactions appear to differ from the market as a whole. Insiders disproportionately buy shares in small firms, value stocks and recent underperformers, while they sell mainly growth stocks that have generated high recent returns. However, after correcting for these characteristics there remains a significant abnormal performance for purchase portfolios of 50 basis points a month. The sale portfolio does not earn abnormal returns. A CAPM-based approach results in a significant abnormal return of 67 basis points a month. The authors do find a relationship between trade volume and abnormal return, but they report no correlation with abnormal returns for firm size and the insider’s position.
In Europe, results are less pronounced. On the London Stock Exchange, Pope, Morris and Peel (1990) report a 6-month cumulative abnormal return for insider purchases of 2.9% and an cumulative abnormal return of -6.7% for insider sales. Surprisingly, the abnormal return for sales is larger than for purchases, which actually appeared to be statistically insignificant. Before the event, there are no abnormal returns. Using a portfolio-based approach, Eckbo and Smith (1999) find zero or negative abnormal performance for insider trades on the Oslo Stock Exchange. Finally, Del Brio, Miguel and Perote (2001) conclude for a combined sample of the Madrid Stock Exchange and the Spanish continuous market that, although insiders earn excess returns, outsiders mirroring their trades do not.
Data and methodology
 Data – For this study, we used the public register of Autoriteit Financiële Markten (or AFM, the financial markets regulator in the Netherlands). The register can be accessed for free by internet at www.afm.nl. Insiders, their family up to the second degree, large shareholders and the company itself have to disclose their transactions in shares of their own company. The register contains disclosed trades in stocks, options and warrants. From 1 April 1999 through 31 May 2002, the number of disclosures for companies listed on Euronext Amsterdam totals 6701. After excluding transactions directly related to (granted) options, warrants and incomplete or inconsistent disclosures, 2517 disclosed transactions in stocks remain. Subsequently, we selected the 1079 transactions from insiders, which we categorized into directors, supervisory directors and other management using Bloomberg, the Reach-database and companies’ annual reports. Prices, total returns, book-tomarket ratios and market capitalization data are from Thomson Financial Datastream.
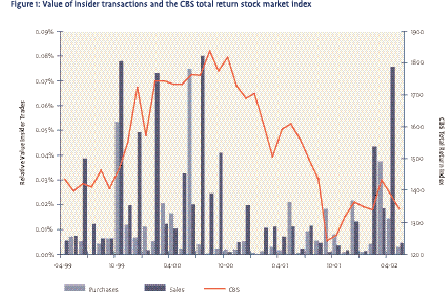
Figure 1 shows the monthly values traded by insiders compared to the total value traded of all companies on Euronext Amsterdam, as well as the CBS total return index (a broad-based index compiled by the national statistics agency) as a proxy for the market. Insider purchases represent on average 0.011% of the total value traded, while this is 0.021% for sales.
It is remarkable that, before the market started its downward trend in October 2000, the traded value of insider sales in July, August and September 2000 all rank in the top 10 of the 38 months in our sample. These months are also characterized by low insider purchases. This could be an indication of the predictive value of aggregate insider trade data. However, due to the limited size of our sample we were not able to examine this item thoroughly.
The total volume traded, as a bold proxy1 for the chance for outsiders trading against an insider, is on average 0.04% a month of total volume traded for insider purchases and 0.03% for sales, with outliers up to 0.45%. This means that the possible costs for trading against insiders are low. Jeng, Metrick and Zeckhauser (1999) report averages for value-weighted volume traded of 0.03% for purchases and 0.22% for sales for the US market, again expressed as a percentage of the total volume traded. The high number for insider sales in comparison with the Dutch market suggests that American firms remunerate managers more often with options.
In this study, we examine the market’s reaction to insider trades in two ways. First, we employ an event study to analyse the short-term return impact. Second, we evaluate the performance of a buy-and-hold strategy that goes long in stocks with insider buying and short in stocks with insider selling. For the buyand-hold strategy we use an investment horizon of six months.
Methodology – For the event study, we calculated abnormal returns as the difference between the actual return and the normal return for a stock. We estimated normal returns with the market model, which supposes that a stock’s return relates to the market and to a company-specific part. For an overview of event-study methodologies, we refer to Brown and Warner (1985). We estimated parameters using an ordinary least squares regression in a control period of 250 trading days before the event period. We used the CBS total return index as the market index.
The test period runs from day -20 up to day 20 and has a length of 41 trading days. Day 0, the event day, is the first day after the insider trading action, as indicated in the Authority-FM register. This is also the first day that disclosures could be made public, but insiders have to disclose their trading activities within five days after the transaction. We assumed that insiders disclose at the last moment, i.e. day 4, which is made public at latest at day 5.
We determined the abnormal return during the event period for every day and every event as the difference between the realized return and the normal return. We then calculated the average abnormal return (AAR) per day. Next, we used a standardized t-test and a rank test to determine whether these abnormal returns statistically differ from zero. For insider sales, we interpreted negative abnormal returns as positive. Therefore, in our sample with both purchase and sale transactions, we multiplied the abnormal returns for sales by -1. We calculated Cumulative Abnormal Returns (CAR) by summing abnormal returns for different periods in the event period.
With an event study, it is important that no events overlap, as this could mean that abnormal returns result not only from the specific event, but from other events as well. We therefore removed all overlapping events from the sample. 137 non-overlapping events remain in the event study, composed of 72 insider purchases and 65 insider sales for a total of 79 companies.
To examine a buy-and-hold strategy, we used another methodology. Each month we determined for each company whether insiders generate a buy or a sell signal, based on the unanimity shown by insiders. If insiders purchase and sell a stock in the same month, or if there is no insider action at all, the stock will be excluded from the sample for that month. We constructed insider purchase and insider sale portfolios for each month with a holding period of 6 months. Portfolios are constructed as of the first trading day in a month. Here, our sample consists of 359 transaction months, with 165 purchase months and 194 sale months for a total of 95 companies.
We calculated buy-and-hold abnormal returns (BHAR), defined as the difference between the actual return for a stock and the benchmark’s return. The portfolios were equally weighted on the date they were constructed.
We started with the CBS total return index as a benchmark. However, Jeng, Metrick and Zeckhauser (1999) show that the insider sample can differ from the market sample on size and value/growth characteristics. Since Fama and French (1992) conclude that returns depend on size and book-to-market ratios, we could have derived a biased BHAR.
To check the robustness of our results, we therefore also calculated BHAR for all stocks with a smallcap or a largecap index as a benchmark, and with a value or a growth index as a benchmark. For this purpose we classified all companies in the Dutch stock market into smallcap or largecap, based on their average market capitalization during the sample period. Then, we composed market-capitalization-weighted smallcap and largecap total return indices. Subsequently, we calculated BHAR as the difference between the actual return for a stock and the size index that belongs to that specific stock. Similarly, we corrected for a possible value or growth bias. We classified all companies into value or growth based on their average book-to-market ratio, using the methodology of the Morgan Stanley Capital Indices. Finally, we also composed combined indices for the size and value/growth effects, by constructing a smallcap value index, a smallcap growth index, a largecap value index and a largecap growth index, to check for a combined effect.
As a final check of the robustness of our results, we used the Capital Asset Pricing Model (CAPM), which supposes that the required rate of return for a portfolio or asset consists of the risk-free rate plus a risk premium. The risk premium depends on the quantity of risk taken, beta, and the market price for risk, Rm – Rf . By means of a regression analysis of the portfolio’s return and the market return, both minus the risk-free rate, we estimated beta. The intercept in the regression analysis, alpha, can be interpreted as the abnormal return of the portfolio and is known as Jensen’s (1969) alpha. We used daily data. In formula:
(Ri – Rf ) = αi + βi × (Rm – Rf ) (1)
where Ri is the rate of return for portfolio i, Rf is the risk-free rate, Rm is the market return, αi is the alpha of portfolio i and βi is the beta of portfolio i.
 Empirical results
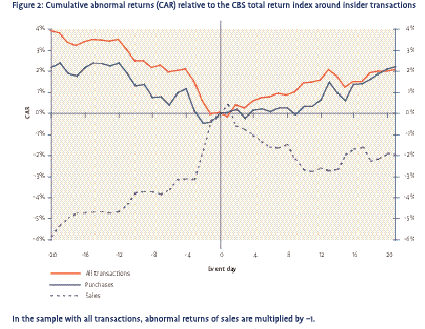
Event study – As appears from figure 2, there is a reversal around day 0 in the Cumulative Abnormal Returns (CAR). Before the transaction, insider purchases on average show negative abnormal returns, followed by positive abnormal returns afterwards. The reverse applies to insider sales. Table 1 shows CAR for different subperiods in the event period. The results prior to the transaction are especially noteworthy for the insider sales. On average an insider sells after a period of outperformance that cumulates to 3.11% in 5 days and 5.82% in 20 days before the tranction. The t-test indicates these results to be highly significant. Stocks with upcoming insider buying show an insignificant underperformance before the event.
For the whole sample the abnormal return cumulates to 2.08% in the 21-day post-transaction period, for purchases this is 2.23% and for sales -1.91%. In general these results are statistically significant to highly significant, as is also shown in table 1.
Suppose that insiders disclose their transactions on day 5, the latest permissible date, then still there is an abnormal return for outsiders of 1.28% from day 6 to 20 for the whole sample. This amounts to 2.16% for the purchase sample, and -0.31% for the sale sample. These results are all significant. There would appear to be no incentive for outsiders to sell stocks with insider sales, since they realize an economically non interesting negative abnormal return in period 6 to 20. For the period 6 to 10 the results are insignificant. In period 0 to 5 insiders realize an average abnormal return of 0.80% for the whole sample, an insignificant 0.07% for purchases but a significant - 1.60% for sales. These results suggest insider sellers to have good timing capabilities in the very short run.
 The results of our event study are in line with Seyhun (1998) for the United States. For the period 0 to 20 and 6 to 20 insider purchases realize higher absolute abnormal returns than insider sales. Insider sales can be triggered by various reasons such as liquidity or diversification, however purchases are often made on valuation grounds. From a diversification point of view insider purchases very quickly become irrational, since insiders are already financially tied to their company by their salary and bonuses.
For several event windows we regressed transaction value, the insider’s position within the firm and the market capitalization on the CAR to estimate their importance. However, contrary to research for other markets, this analysis did not reveal significant results.
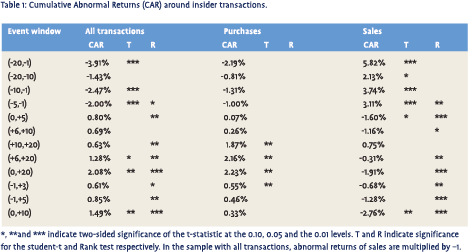
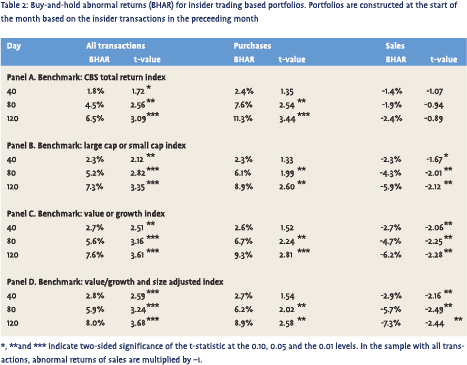
Buy-and-hold strategy – Figure 3 shows the buyand-hold abnormal returns (BHAR) for insider trading based on portfolios with a holding period of 6 months, with the CBS total return index as benchmark. The insider purchase portfolio gradually outperforms the benchmark, while the insider sale portfolio underperforms. As appears from table 2 panel A, for the whole sample (long in insider purchase portfolios and short in insider sale portfolios), the outperformance amounts to 1.8% after 40 trading days, to 4.5% after 80 trading days and to 6.5% after 120 trading days. The abnormal return after 120 trading days is 11.3% for the purchase sub-sample and -2.4% for the sale sub-sample. For the purchases sub-sample these results are significant, but for the sales sub-sample they are insignificant.
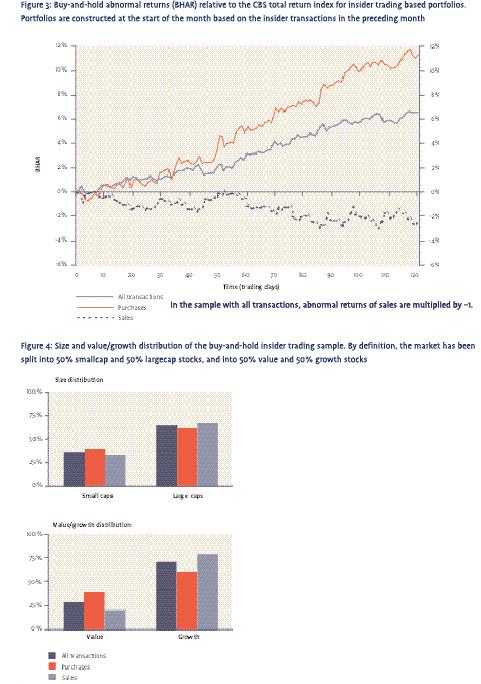 Figure 4 shows the size and value/growth characteristics of our sample. By definition we split the market into 50% smallcap and 50% largecap stocks, and into 50% value and 50% growth stocks. It appears that growth stocks and largecaps are overrepresented in our buy-and-hold sample, for insider purchases as well as sales. However, this bias towards largecap and growth stocks is strongest in the insider sales sub-sample. Therefore, our results could be influenced by a size and/or value/growth effect.
Using other benchmarks, differentiating by size and/or value/growth characteristics, leads to a slight change in results. The results for insider sales portfolios become significant, see panels B to D in table 2. This could be due to the difference in size and value/growth characteristics with the market, as discussed above. When we use a size- and value/ growth-adjusted benchmark, the outperformance after 120 days for the whole sample is 8.0%, for insider purchase portfolios this is 8.9% and for insider sale portfolios -7.3%, all results being economically and statistically significant. In general, insider purchase portfolios generate stronger outperformances than insider sale portfolios. From our CAPM-based robustness check it appears that the alphas correspond well to the outperformance reported in table 2.
The results of the 6-month buy-and-hold strategy are in line with the shorter-term event study. We find the strongest signal from insider purchases. The results appear to be robust after controlling for possible size and value/growth effects, and checking with the CAPM. Taking transaction costs into account, mirroring insiders with a buy-and-hold strategy delivers economically interesting returns since we estimate round-turn transaction costs at 1% to 2% for retail investors and around 0.4% for institutional investors. Insiders appeared to be good predictors for a 6-month horizon, which is consistent with the reported results for the American market.
Summary and conclusions
To improve market transparency, the disclosure of insider trading has been required in the Netherlands since April 1999. This enables us to examine the profitability of insider trading in the Dutch stock market. In this study we examine the price pattern around insider trades for the period April 1999 to May 2002, focusing on transactions of management and supervisory directors.
 The results prior to the transaction are especially noteworthy for the insider sales. On average an insider sells after a period of significant outperformance that cumulates to 5.8% in 20 days before the tranction. Stocks with upcoming insider buying show an insignificant underperformance before the event. Our event study shows a clear reversal around the insider transaction day. On average, insiders realize positive abnormal returns in the 5 days after their transaction. Again, only the results for insider sales are significant. This supports the view that, on average, insider sellers have good timing capabilities in the very short run. In the period 6 to 20 days after the transaction insider buys generate a significant 2.2% outperformance while insider sales yield an economically non interesting underperformance of 0.3%. So, outsiders can also achieve short term benefit from insiders’ dealings, especially by focusing on the insider buys.
For several event windows we regressed transaction value, the insider’s position within the firm and the market capitalization on the CAR to estimate their importance. However, contrary to research for other markets, this analysis did not reveal significant results.
We use a buy-and-hold strategy to test for an investment strategy based on the last month insiders’ transactions. We report outperformances for insider purchase portfolios of 8.9% up to 9.3% in 6 months, after controlling for possible size and/or value/growth effects in our sample. Insider sale portfolios underperform between 5.9% and 7.3%. The results are all significant. The abnormal returns are realized gradually during the 6-month buy-and-hold period. A CAPM check showed our results to be robust. Insider purchases appear to result in higher absolute abnormal returns than insider sales. Insider sales can be triggered by various reasons such as liquidity or diversification, however, purchases are often triggered on valuation grounds.
Our results suggest that insider trades in the Dutch stock market do provide valuable information for investors. However, market prices do not fully reflect this information since there is no timely price adjustment to it. There is still room for investors to exploit this opportunity. Future research should reveal whether aggregate insider trading in the Dutch stock market also provides valuable information for the direction of the market as a whole. Our sample is too short to test the aggregate predictive power of insider trading.
References
- Brown, S.J. and J.B. Warner, 1985, Using Daily Stock Returns: the Case of Event Studies, Journal of Financial Economics, vol. 14, no. 1, 3-31.
- Del Brio, E.B., A. Miguel and J. Perote, 2002, An Investigation of Insider Trading Profits in the Spanish Stock Market, The Quarterly Review of Economics and Finance, vol. 42, no. 1, Spring, 73-94.
- Eckbo, B.E. and D.C. Smith, 1998, The Conditional Performance of Insider Trades, Journal of Finance, 53, no. 2, 467-498.
- Fama, E.F. and K.R. French, 1992, The Cross-section of Expected Stock Returns, Journal of Finance, vol. 47, no. 2, 427-465.
- Jeng, L.A., A. Metrick and R. Zeckhauser, 1999, Estimating the Returns to Insider Trading, forthcoming in The Review of Economics and Statistics.
- Jensen, M.C., 1969, Risk, the Pricing of Capital Assets, and the Evaluation of Investment Portfolios, Journal of Business, vol.42, no. 2, 167-247.
- Pope, P.F., R.C. Morris and D.A. Peel, 1990, Insider Trading: Some Evidence on Market Efficiency and Directors’ Share Dealings in Great Britain, Journal of Business and Accounting, vol. 17, no. 3, Summer, 359-380.
- Seyhun, H.N., 1988, The Information Content of Aggregate Insider Trading, Journal of Business, vol. 61, no. 1, 1-24.
- Seyhun, H.N., 1998, Investment Intelligence from Insider Trading, MIT Press, Cambridge MA, USA.
Endnotes
- These probabilities are somewhat underestimated since not all ‘informed’ traders are required to report.
Acknowledgements
The authors are grateful to an anonymous referee for useful comments and to Nicholas Baker for editing.
in VBA Journaal door Mathijs A. Biesta (r) Ronald Q. Doeswijk (l) Han A. Donker