
Artificial Intelligence and Large Language Models (LLMs) are adapted by society on an increasingly larger scale. Consequentially, they also make their way into the investment industry. This article discusses LLMs and their application in investments.
The first part of this article discusses LLMs in general and how they impact the investment industry. It describes the various kinds of LLMs, the risk involved in the use of LLMs and the types of applications they can be used for. The author argues that traditional fundamental analysts aren’t wired to identify which textual information is already captured by the numbers (see also earlier research by Van Cappelle and Niesert, 2021). LLMs, on the other hand, can be trained for specific tasks and can be used at scale. This is true for many models, including those that predict future revenue growth, costs, or analysis of Environmental, Social, and Governance (ESG)-related topics. At the end of the first part, the article elaborates on how investment firms will need to adapt to use LLMs or work with data derived by LLMs.
The second part of this article focuses on quantitative strategies. The author uses forecasts that are exclusively available by LLMs to conduct an empirical analysis. The analysis compares the LLM-derived forecasts with more traditional forecasts. Additionally, the author scrutinizes the LLM-derived forecasts by formal tests that involve established factor models. The analysis shows that these new forecasts are complementary to traditional quantitative factors and robust to implementation choices. The article concludes that quantitative investors will have to embrace the use of LLMs to stay relevant and add new sources of robust alpha.
 THE RISE OF LARGE LANGUAGE MODELS
Automated processing of text (Natural Language Processing) has existed for many years. However, NLP models didn’t enter the mainstream media until the launch of ChatGPT in November 2022. Since this time, ChatGPT has impressed society at large both by its breadth of applications and its seemingly understanding of questions. As a result, 2023 is seen by many as the year of Large Language Models (LLMs), and reservations about using LLMs have largely disappeared. To many, they are seen as a silver bullet that can fix anything.
The current success and wide acceptance of LLMs has been in the making for quite a few years; in 2018, two models emerged that are the basis of today’s most well-known LLMs:
- The Generative Pretrained Transformer (GPT) (Radford et al., 2018) and
- Bidirectional Encoder Representations from Transformers (BERT) (Devlin et al., 2019)
These two models represent different types of Large Language Models: the decoder model and the encoder model.
Decoder models are LLMs trained to generate text that makes a good conversation. Note that the primary learning objective, when decoder LLMs are trained, is not to provide responses that are factually correct.2 Rather, the objective is to provide responses that are liked by the person asking the question. OpenAI’s GPT-4 model is the state-of-the-art decoder model.
OpenAI has surrounded the GPT-4 model with supporting software and deep learning models to mitigate the inherent risks in using a decoder model. For instance, to prevent generating racist text. As decoder LLMs generate text, they are often referred to as Generative AI.
Encoder LLMs are good at summarizing text. An example would be a classification task in which the sentiment of a certain text is classified as being positive, negative, or neutral. One of the state-of-the-art encoder models is Microsoft’s DeBERTa3 LLM. Where decoder LLMs were dubbed Generative AI, Encoder LLMs can be either referred to as Interpretive AI or Predictive AI. Interpretive AI when it summarizes the current situation. Predictive AI when it classifies future events based on text.
A special type of classification is the so-called zero-shot classification. A zero-shot classifier is an LLM that isn’t trained on a pre-defined set of labels. Instead, it receives as input both text and several labels to choose from. This makes zero-shot classifiers very flexible as, in theory, they can be used at any classification task.
APPLICATIONS OF LARGE LANGUAGE MODELS IN THE INVESTMENT INDUSTRY
With this broad overview of LLMs in mind, one can think of a variety of applications in the investment industry
Generative LLMs can be used to support the production of investment reports. Interpretive LLMs can be used to identify current trends at companies. For instance, they could be used to identify ESG related risks. Predictive LLMs can be used to forecast company fundamentals, like future earnings or future revenue growth. Since this article describes the application of LLMs to company analysis, the focus is on predictive and interpretive LLMs.
The use of LLMs in analyzing companies has three distinct advantages:
- LLMs can be applied at scale. Where an analyst at an investment firm typically covers 30 to 50 companies, an LLM can analyze thousands of companies.
- LLMs produce consistent and comparable analysis. Where one analyst may have a different interpretation from another analyst, or even her own judgement could vary with time, LLMs will produce the same analysis for the same text.
- LLMs can be trained for specific tasks. Humans are very good learners of languages, but they are not good at “not reading” certain text. LLMs on the other hand can be trained to focus on a specific task and not be distracted by other information present.
Obviously, the use of LLMs is not without risk. First, while LLMs produce consistent results, their results can still be prone to biases. As pointed out in earlier research (Van Cappelle and Niesert, 2021), at any point in time, just 10 companies account for more than 50% of all company-related news articles and social media posts. This leads to huge biases towards these companies. Additionally, it is well known that neural networks, and therefore LLMs as well, can easily learn relationships that don’t exist.
Besides the risks mentioned here, there are also considerations to be taken around information security and potential intellectual property infringement. Some of the most powerful LLMs can only be invoked through an Application Programming Interface. This means that the textual data is shared with the provider of the LLM. In the case of a proprietary text source there is the risk of information leakage. Considering LLMs are trained on large swaths of text, that are available on the internet, there are increasing concerns and claims that the LLMs might infringe copyrights.4
In summation, while LLMs are clearly powerful, specific skills are required to understand and mitigate the risks related to their implementation.
WAYS TO USE LARGE LANGUAGE MODELS AS AN INVESTMENT FIRM
Let’s look in a little more detail at how investors can benefit from the application of LLMs. What are the ways to access LLMs, and for which type of analyses can LLMs be useful?
There are broadly three ways investors can use LLMs. First, investors can use LLMs that are publicly available. For instance, there are publicly available LLMs that can classify text according to financial sentiment, such as finbert-tone, a model developed by Huang et al. (2022). The second way would be by developing an LLM oneself. This would have the benefit of having complete proprietary insights. However, the effort, investment in human capital, and the risks involved are easily underestimated. The third way would be to use commercially available forecasts or insights made by LLMs, or to license a commercial LLM. The latter would be an option in case theLLM is used to process proprietary textual data.
INTERPRETIVE LLMS AND PREDICTIVE LLMS CAN IDENTIFY AND PREDICT TRENDS AT COMPANIES
The type of analyses which could be done with LLMs are probably endless. Yet a few of the common analyses include:
- Sentiment analysis. There are numerous commercial data sets which determine sentiment surrounding companies. Apart from those commercial data sets, there are various publicly available models for sentiment analysis, amongst others yiyanghkust/finbert-tone (Huang et al., 2022) and ProsusAI/finbert (Araci, 2019)
- ESG and SDG classification. Given the need for more ESG data among investors, LLMs provide a good way to extract ESG information, and information related to SDGs from unstructured data. Again, there are lots of commercial data sets created by applying LLMs, and there are public LLMs for ESG or SDG classification as well.
- Forecasting company fundamentals like revenue and cost. There are vendors who sell data sets that forecast revenue, costs, and other fundamentals based on company’s management discussions and press releases.
- For the analysis of human capital and governance one could use commercially available specialty data sets which analyze the language surrounding appointments and departures of company management.
- Finally, for thematic or one-off research it is recommended to use a zero-shot classifier. The upside of zero-shot classifiers is that they don’t need to be trained for a specific task. Which is especially useful in case there are only a few labeled samples to train on, or the task at hand is a one-off. The flipside is that zero-shot classifiers aren’t trained specifically for a task. That said, currently one of the most popular zero-shot classifiers is also trained on the financial phrase bank (Laurer et al., 2022)
ARCHITECTURE OF LARGE LANGUAGE MODELS
 To provide more context to what a Large Language Model and its surrounding software might consist of, let’s look at the most common parts of a language model. Broadly the model consists of a:
- pre-processing module
- tokenizer
- deep-learning network
- task-specific head
- post-processing module
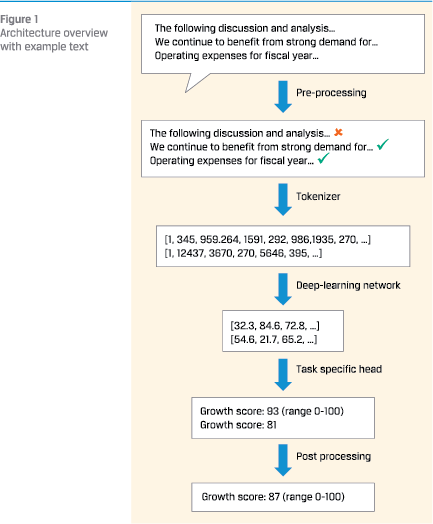
Figure 1 gives an overview of the architecture with an example.
The pre-processing module is where the raw unstructured data is reformatted and possibly filtered for consumption by the LLM. So, management discussions or press releases will be converted to machine readable text. Text that runs over multiple pages will be ‘glued’ together; sentences or paragraphs are restored as intended. For training purposes, the training target will be calculated. Finally, there is most of the time a ‘relevancy-filter’ in place to take out irrelevant text. For instance, disclaimers, introductory text, or boilerplate language that is used in every report or press release of the company are not of interest.
The tokenizer is a part of the model where text is converted to numbers. This is a necessary step. When developing a model from scratch, a choice needs to be made, whether to re-use an existing tokenizer or train a tokenizer from scratch. Often an existing tokenizer is re-used, which creates the next choice: a) use a tokenizer that is specific for financial text, or b) use a tokenizer that is more generic. What works best is often an empirical question.
THE APPLICATION OF LLMS WILL HAVE AN IMPACT ON HOW INVESTMENT FIRMS OPERATE
The deep-learning network can be considered the heart of the LLM. Again, there are a few choices to be made. Will the network be trained from scratch or will a pre-trained network be re-used. Often the choice is to start off from a pre-trained network. That still leaves many questions open: go with a Bert-based model or use larger models like RoBERTa or DeBERTa? Use a pre-trained model which is trained on financial text or use a pre-trained model that is trained on more generic text?
The task specific head is the final layer that is put on top of the deep-learning network. In the case of a sentiment classifier, the task-specific head would provide probabilities for the text to be positive, negative, or neutral.
The post-processing module is where the outcome of the task-specific head is processed further to an outcome. Say a large document is processed in multiple parts. Then the score for each part needs to be aggregated into a score for the overall document. Post-processing typically includes some weighting scheme or perhaps more complex functions.
For certain tasks it can be useful to have multiple models work together. In the case of ESG analysis, it could be useful to have a first model that identifies paragraphs of text that discuss a certain ESG related topic. A second model trained specifically on the ESG subject in question could further analyze the paragraphs involved in the subject.
IMPACT ON INVESTMENT FIRMS
The application of LLMs by investment firms will have an impact on how they operate. Specifically, it will have an impact on the distribution of human resources. As established earlier, there will need to be an allocation of human resources to the use of LLMs to enjoy the new possibilities that they offer.
Investment firms that decide to develop LLMs themselves, or use publicly available LLMs, will need to make a considerable investment in human capital to develop the know-how to create, test and maintain these LLMs. The requirement of special skills in developing and operating LLMs is proven by the emergence of new job titles, like “prompt engineer”,5 which didn’t exist in 2021. Furthermore, investment firms that choose to buy data created with LLMs, choose to license commercial LLMs, or use public LLMs, will need to have a basic understanding of what they are using
The shift of resources to the development and application of Large Language Models needs to be paired with a gain in efficiency. The most obvious candidate for efficiency gain is in the field of traditional corporate analysis. Investment firms will either decide to automate part of their in-house analysis, or they use the analysis done with the help of LLMs to steer their in-house analysis towards the most promising investment opportunities.
Besides efficiency gains, new possibilities will emerge that simply didn’t exist before. A powerful feature of Large Language Models is that they can be trained for specific tasks without being distracted by anything that is irrelevant to the task at hand. Earlier research by Van Cappelle and Niesert (2021) has shown that LLMs are capable of forecasting future revenue growth that cannot be inferred from the income statements of companies.
In short, the impact of Large Language Models for investment firms will be a shift towards new roles in the field of AI, efficiency gains in the field of traditional analysis and access to information and forecasts that simply wasn’t accessible before.
IMPACT ON QUANTITATIVE INVESTMENT STRATEGIES
The second part of this article will discuss the impact on quantitative strategies. Quantitative strategies are strategies that are fully data driven. First the data and the test setup will be explained. Next the results will be discussed.
Quantitative strategies are employed by quantitative hedge funds, mutual funds, and pension funds. Quantitative hedge funds usually employ shorter term strategies with holding periods that are expressed in days or weeks. Mutual funds and pension funds usually employ strategies with somewhat longer holding periods that are expressed in months or quarters. Therefore, the test will examine characteristics over a variety of investment horizons.
To study how quantitative strategies could benefit from LLMs, the author explores a commercially available data set. This data set is created with the use of LLMs. The test uses two forecasts that are part of this data set: Revenue Surprise forecasts and Growth Acceleration forecast. To compare the results with a more traditional dataset, the test also includes consensus revenue growth forecasts by institutional broker analysts.
The Revenue Surprise forecast aims to predict the amount of surprise in the revenue growth that will be reported in the next quarter by a company. The forecast is created as soon as companies publish their quarterly report. In the forecast a separation is made between the revenue growth that can be forecast using information from past income statements, and what extra information is contained in the management discussion and press release of a company. The extra information is captured by the Revenue Surprise forecast. It is expressed in a number ranging from 0 to 100. Values over 50 indicate a positive expectation for growth stemming from the textual data, whereas values below 50 indicate a negative expectation. The LLM, with which these forecasts are created, is trained on data from 1994 until 2007.6
The Growth Acceleration forecast is a more sophisticated forecast that considers the previous 10 earnings reports and predicts whether revenue growth is on an accelerating trend or not. The forecast is expressed in numbers ranging from 0 to 100. Values over 50 indicate that revenue growth is expected to accelerate. Those below 50, on the other hand, indicate that growth deceleration is expected. Like with the Revenue Surprise forecasts, the model to produce the Growth Acceleration forecasts is trained on data from 1994 until 2007.6
Under normal circumstances, the Revenue Surprise and Growth Acceleration forecasts are available within an hour after an earnings announcement. Yet, to be on the safe side for testing purposes, it is assumed that the forecasts are available as of the day after the earnings announcement.
The traditional data set contains forecasts for next quarter’s revenues made by analysts. The data is from a commercially available database of institutional broker estimates. Every time an analyst updates the forecast for the next quarter’s revenue, the data is updated in the data set. The forecasts of different analysts are averaged daily per company. The average of these forecasts, when compared to previous revenue numbers, gives what is referred to as a Consensus Growth forecast.
The stock universe on which these data sets are tested consists of the 3000 largest stocks in the US market by market capitalization. The 10 full years spanning from 2013 until 2022 were chosen to conduct the research. The start date of 2013 ensures that the test is free from any possibly forward-looking biases, as all training and parameter tuning for the LLMs happened before 2013. While as of 2013, the search for alpha from textual sources had already begun. Quantitative investors had already been applying NLP techniques to management discussions, press releases, and analyst calls.
STRATEGY EXPLORATION
For the first test, quintile portfolios are created daily for various investment horizons. It is best to describe the daily creation of portfolios in a step-by-step procedure:
- . The investible universe is determined. All stocks are selected that are among the 3000 largest stocks in market capitalization.
- Based on the investment horizon, stocks are filtered out. Say, the investment horizon is 2 weeks, then any stock that had an earnings announcement more than 2 weeks ago is excluded.
- The stocks are ranked according to their forecasts. Stocks with the best forecast end up in the first quintile, stocks with the worst forecast end up in the bottom quintile.
- All the stocks in a quintile form an equally weighted portfolio.
- From the best and the worst quintile, a long-short portfolio is created. The long/short portfolio is 50% long in the best quintile and 50% short in the worst quintile.
For each forecast, this procedure is repeated with investment horizons of 1, 2, 5, 10 and 20 weeks.
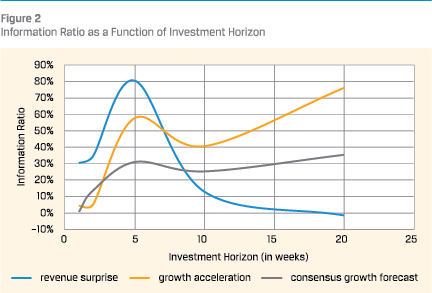 The resulting Information Ratios of the respective test/forecast combinations are shown in figure 2.
The chart shows that the Revenue Surprise forecast yields higher information ratios over shorter investment horizons than the Growth Acceleration forecast. A possible explanation is that the Growth Acceleration forecast is more sophisticated than the revenue forecast. As such, one might expect that it would take longer for the market to figure this out.
It is also noticeable that the information ratio of the Revenue Surprise forecast increases as the investment horizon increases from 1 week to 5 weeks. This doesn’t necessarily mean that the information is more powerful after 5 weeks. It might also reflect the fact that with an investment horizon of 5 weeks, the quintile portfolios get better diversified. This is because more companies had their earnings announcement in the last 5 weeks than in the last week, hence each quintile portfolio will include more names. Furthermore, companies have the tendency to have their earnings announcements around the same dates (earnings season). This causes even sparser portfolios between earnings seasons.
The information ratio of the Revenue Surprise forecast fades out as the investment horizon becomes longer. This indicates that the signal is better suited for investors who pursue strategies with shorter holding periods.
REVENUE SURPRISE AND GROWTH ACCELERATION DATA UNLOCK INFORMATION THAT IS NOT AVAILABLE BY TRADITIONAL MEANS
The Information Ratio of the more traditional Consensus Growth Forecast is for any investment horizon lower than at least one of the forecasts produced by LLMs. This implies that the Revenue Surprise and Growth Acceleration data unlock information that is not available by traditional means.
Finally, it is observed that the information ratio of the Growth Acceleration forecast shows a small dip at a 10-week investment horizon, or a small bump at the 5-week horizon. The same effect can be seen to a lesser extent with the traditional Consensus Growth forecast. There is no obvious explanation for this phenomenon.
EVALUATING PERFORMANCE
Based on the initial analysis it is decided to further explore four forecast/investment horizon combinations:
- Revenue Surprise – 1-week horizon
- Revenue Surprise – 5-week horizon
- Growth Acceleration – 20-week horizon
- Consensus Growth – 20-week horizon
For the 5- and 20-week investment horizon, the creation of quintile portfolios is further enhanced to control for size. The investible universe is split into the 1,000 largest stocks and the 2,000 stocks that are smaller (like how the Russell 1000 and Russell 2000 are constructed).7 For each group the quintile portfolios are created through the same procedure as before. The long/short portfolio is constructed by being 25% long in the best quintile of the 1,000 largest stocks, 25% long in the best quintile of the 2,000 smallest stocks, 25% short in the worst quintile of the 1,000 largest stocks and 25% short in the worst quintile of the 2000 smallest stocks.
With the 1-week investment horizon the size-control enhancement is not feasible as there would be too few stocks eligible at times to create quintile portfolios. So, for the 1-week investment horizon we keep the portfolios as before. However, a different risk measure is taken for the 1-week long/short portfolio: to mitigate the effects caused by few stocks between earnings seasons, the amount of risk is adjusted based on the breadth of the portfolio.
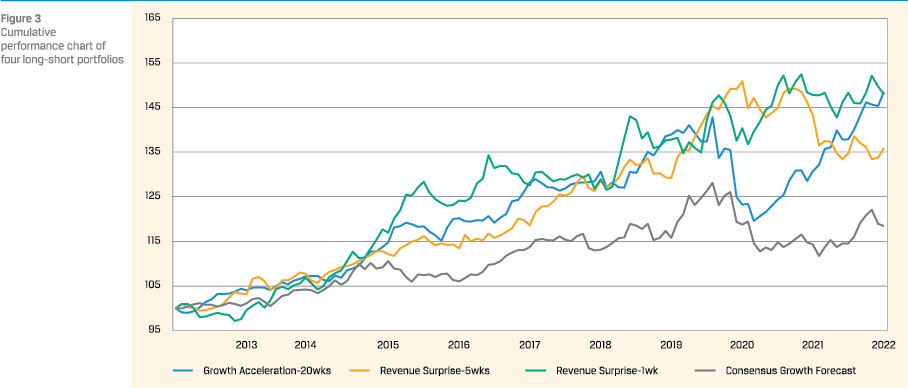
The cumulative performance of these four strategies is depicted in figure 3.
 It is immediately clear that each strategy has its peaks and troughs, but visually they don’t seem to happen at the same time. In other words, the three LLM strategies are not overly correlated. Numerical analysis learns that among the LLM forecasts the highest pair-wise correlation is 0.33 (between the 1-week and 5-week Revenue Surprise strategies). The highest pair-wise correlation between the Consensus Growth strategy and the LLM strategies is 0.55 (between Growth Acceleration and Consensus Growth).
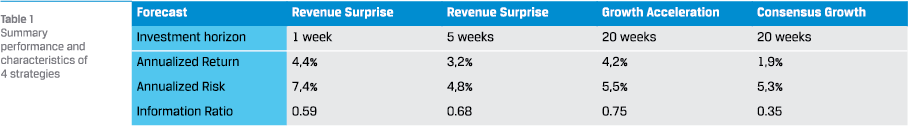
The performance of the 4 strategies is summarized in table 1.
The table confirms that the LLM-based forecasts deliver higher information ratios than the more traditional growth forecasts.
Additionally, the table shows that the 1-week investment horizon Revenue Surprise portfolio benefits a lot from the risk adjustment based on the number of stocks in the portfolio. In the initial set up the 1-week investment horizon gave an information ratio of 0.3, with the risk adjustment, the information ratio increased to 0.6.
LLMS DELIVER ROBUST ALPHA
As the alpha potential of LLMs is shown, further analysis is conducted into the robustness of the alpha.
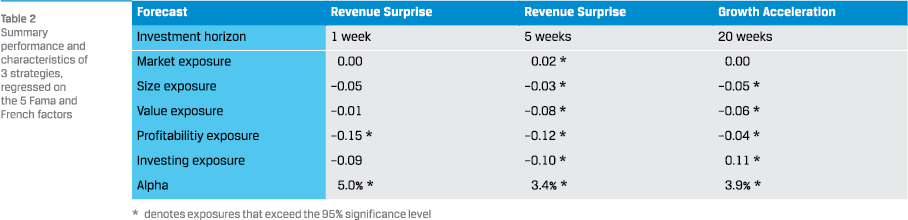 To analyze the return characteristics further, the returns are regressed on the Fama and French 5 factor model (Fama and French, 2015). The regression coefficients as well as the alpha are presented in table 2.
The table tells us that neither strategy is overly exposed to any factor. The strategies based on this new source of information are complementary to established quant factors. It can also be seen that the factor models are not explaining away the excess return of the long-short portfolios; again, a sign that this new source of information is additive to established factors.
All in all, it can be concluded that the forecasts based on LLMs offer alpha opportunities for active investors regardless of their preferred investment horizon.
The Fama-MacBeth (Fama and MacBeth, 1973) regression is widely accepted as a formal test to see whether exposure to a factor is rewarded. Hence, this empirical study includes such a regression as well.
The Fama-MacBeth procedure is as follows:
- Several (at least 7, preferably more) portfolio-return series serve as input to the procedure.
- A time series regression is done of each of the portfolio excess returns on the factor returns to establish the exposure to factors for each portfolio.
- A cross-sectional regression is done for each period of the portfolio returns on their factor exposures from step 2. This cross-sectional regression produces the factor premia for each period.
- The resulting time series of factor premia are averaged, and the standard errors are calculated. This gives an observed reward as well as a confidence interval.
The Fama-MacBeth regression is applied to the Revenue Surprise forecast with the 5-week investment horizon as well as to the Growth Acceleration forecast. The quintile portfolios of both the larger stocks as well as the smaller stocks are used in the regression; so, there are 10 portfolios which is sufficient for the cross-sectional regressions. The procedure is followed for the Fama and French 3 factor model (Fama and French, 1993) as well as the Fame and French 5 factor model (Fama & French, 2015). In the 3-factor model, the factors Profitability exposure and Investing exposure are not included.
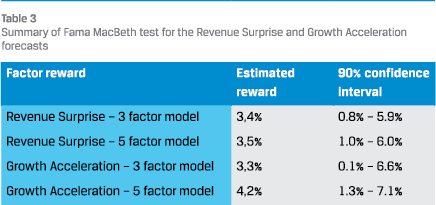 Table 3 reports the reward for the respective forecasts as well as their confidence interval, as found with the Fama-MacBeth tests.
The results show that the cross-sectional reward for both Revenue Surprise as well as Growth Acceleration exists indeed. They are statistically significant different from 0 (at 95% confidence), as the 90% confidence interval is strictly positive.
A final check for robustness involves a change in constructing the long-short portfolio. With the Revenue Surprise forecast, so far, two long-short portfolios have been created. One where plainly 5 quintile portfolios were created and the long-short was the difference between the best and the worst quintile. Next, a double sort on size and Revenue Surprise forecast was created, where the long-short portfolio was made up of the difference between the best large and small quintiles versus the worst large and small quintiles. Now a third long-short portfolio is added to the mix. This time it is controlled by sector.9 We divide the Industrials, Consumer Cyclical, Health Care, and Technology sector in terciles. The long-short portfolios reflect the difference between the best terciles per sector versus the worst sector per tercile. The cumulative return series of the three different choices for a long-short portfolio are compared as a check that the results so far are not driven by a seemingly innocent choice in constructing the portfolio.
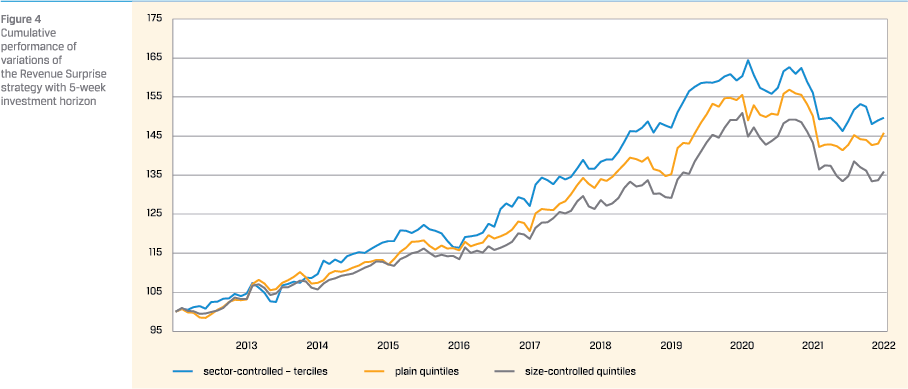
The cumulative returns are plotted in figure 4.
The chart shows that the patterns of the strategies are quite similar. Furthermore, it is visible that the choice for size control in the factor analysis didn’t inflate results. On the contrary, results without size-control or with sector-control instead of sizecontrol are even better.
LLM-DERIVED DATA CAN OFFER COMPLEMENTARY ALPHA
Various tests were applied to the LLM-derived data. By doing all these tests it is established that the alpha of the LLM-derived forecasts is robust, and not influenced by choices in the way portfolios are constructed. Additionally, a formal FamaMacBeth test pointed to an annualized reward of roughly 3.5% for both the Revenue Surprise as well as the Growth Acceleration forecast.
CONCLUSION
In this article the rise of Large Language Models has been discussed, and the impact on the investment industry has been analyzed. What is clear is that investors will need to adapt. Fundamental and quantitative investors alike will need to increasingly shift resources to the use of LLMs.
For fundamental investors LLMs will bring efficiency which can be used to augment or steer their traditional analysis.
It was also shown that forecasts derived using LLMs can produce alpha. This alpha is complementary to what is offered by more traditional and established data. Quantitative investors have no choice but to embrace the use of LLMs to stay relevant.
Literature
- Araci, D., 2019 FinBERT: Financial Sentiment Analysis with Pre-trained Language Models. arXiv preprint arXiv:1908.10063.
- van Cappelle, T. & Niesert, R., 2021, De cijfers voorbij: vanuit tekst omzetgroei voorspellen, VBA Journaal, nr. 147, 26-32.
- Devlin, J., Chang, M. W., Lee, K., & Toutanova, K., 2019, BERT: Pre-training of Deep Bidirectional Transformers for Language Understanding. In NAACL-HLT, pages 4171–4186, Minneapolis, Minnesota.
- Fama, E., & French, K., 1993, Common Risk Factors in the Returns of Stocks and Bonds, Journal of Financial Economics, 22, 3-56.
- Fama, E. & French, K., 2015, A Five-Factor Asset Pricing Model, Journal of Financial Economics, 116, 1-22.
- Fama, E. & MacBeth, J., 1973, Risk, Return and Equilibrium: Empirical Tests, The Journal of Political Economy 81.3, 607-636.
- Huang, Allen H., Hui Wang, and Yi Yang, 2022, FinBERT: A Large Language Model for Extracting Information from Financial Text, Contemporary Accounting Research.
- Laurer, M., van Atteveldt, W., Salleras Casas, A. & Welbers, K., 2022, Less Annotating, More Classifying – Addressing the Data Scarcity Issue of Supervised Machine Learning with Deep Transfer Learning and BERT – NLI. Preprint, June. Open Science Framework. https://osf.io/74b8k.
- Radford, A., Narasimham, K., Salimans, T. & Sutskever, I., 2018, Improving Language Understanding by Generative Pre-Training. https://openai.com/research/ language-unsupervised
Notes
- The author would like to thank Alex Ward Corral, Carmen van Wuijckhuijse, Daryl Smith, Finn van Cappelle, Giulia Mantovani, Judit van der Geest, Roy Hoevenaars, Sandra Toften and three reviewers of the VBA Journaal for their valuable comments and ideas.
- This news article provides an example that illustrates that generative AI is not trained to generate factual correct text https://www.nytimes.com/2023/06/08/nyregion/lawyerchatgpt-sanctions.html
- Huggingface is the place to find pre-trained LLMs, https://huggingface.co/models Models that relate to this article include yiyanghkust/finberttone, MoritzLaurer/DeBERTa-v3-base-mnli-fever-anli, Microsoft/ deberta-v3-large, ProsusAI/finbert and nbroad/ESG-BERT
- Several organizations are taking steps to defend themselves against copyright infringement by ChatGPT https://edition.cnn. com/2023/08/28/media/media-companies-blocking-chatgptreliable-sources/index.html
- A prompt-engineer is someone who specializes in structuring questions or instructions for a generative AI model to obtain the best results.
- The model is refreshed every three years: the forecasts as of July 2013 are based on a refresh with data from 1994 until 2012, the forecasts as of July 2016 are based on a refresh with data from 1994 until 2015, and so on.
- The choice to split the stocks in the 1,000 largest and the 2,000 smaller stocks is the result of balancing between the desire to have both groups represent an equal market cap (requiring fewer large stocks) and being able to construct well diversified quintile portfolios (requiring more large stocks)
- The rule that is used to adjust risk is to multiply the portfolio positions by the square root of the number of stocks in the portfolio and divide by the average of the square root of the number of stocks in the portfolio over the entire test period.
- The TRBC sector definitions are used. For practical reasons, 4 sectors with a large enough number of stocks were selected: Industrials, Consumer Cyclicals, Health Care and Technology
in VBA Journaal door Tjeerd van Cappelle