
HOW MULTI-FACTOR MODELS CAN HELP SELECT CONSISTENTLY OUTPERFORMING EQUITY MANAGERS
INTRODUCTION
This study seeks to answer the hypothesis if an informed X-factor investor3 achieves a better net result than the average investor in a persistent way. Frequently, the question addressed in research is if the average or median manager can outperform a benchmark or the market. Most studies show an average negative net performance due to transaction costs and management fees, also known as the zero-sum game in equity investing. However, whether performance persistence exists is even more critical in the debate on market efficiency, and for institutional asset owners in determining their investment beliefs concerning active and passive management.
 Persistence means that skillful and unskillful managers tend to repeat their historical successes and failures over time. The existence of performance persistence would violate the efficient market hypothesis but would suggest that investors may benefit from putting effort into identifying and selecting a skillful asset manager. Kosowski et al. (2006) and Fama and French (2010) provide evidence that some managers have the skill to pick the right stocks, indicating that their performance is not solely based on luck, and therefore refutes the myth that active investing in equities does not pay off. From the observation that skillful managers exist and can be identified, the logical question arises if these managers can persist in being skillful. The typical process or rule-of-thumb to evaluate active equity managers in practice involves an assessment period of three or five years. If the excess return, not to be confused with the X-factor alpha,4 is disappointing, then it is most likely that the manager will be dismissed and replaced by a manager who was more successful in that period. Arnott et al. (2018) describe this phenomenon as the “Folly of Hiring Winners and Firing Losers” because it turns out to be a losing strategy. In earlier papers such as Goyal and Wahal (2008) and Cornell et al. (2017), this cyclical behavior of investors is also tackled. In these papers the evidence on performance persistence and the value of chasing past winners is mixed, depending on the type of performance measure used and the time horizon over which performance is evaluated.
CONTRIBUTION
First, this study complements and extends previous research in the field of performance persistence by adding the coverage of multiple regions outside the U.S.; such as Global, Global ex-U.S., Emerging Markets, Europe, Japan, Australia and Asia (Pacific) ex-Japan, where the results are compared side-by-side. Papers that, for example, do cover performance persistence among mutual funds investing outside the U.S. are Bialkowski and Otten (2011), Cornell et al. (2020), and Omori and Kitamura (2022). In contrast, most research is done on U.S. mutual funds (e.g., Matallin-Saez et al. (2016), Cornell et al. (2017), and Arnott et al. (2018)). Second, the performance persistence is directly tested on the X-factor alpha with various widely used methodologies: contingency matrices, pooled regressions, and the recursive portfolio approach with accompanied statistical tests on multiple horizons from one month up to five years. Harlow and Brown (2006) and Arnott et al. (2018) examine performance persistence in a pooled regression directly on the alpha. However, in most previous studies, the X-factor alpha is estimated in the second stage of the aggregate excess returns of a typical quantile portfolio. Third, this study focuses on institutional assets instead of mutual funds. As Dyck et al. (2013) noted, the difference between institutional and retail funds’ performance can be significant. Therefore, the dataset used in this study is comprised of gross excess returns, which follows the reasoning of Fama and French (2010) that management fees are not part of the investment skill. The net average performance is estimated where the median quoted management fees and average transaction costs have been applied in selecting and rebalancing the recursive portfolios. Finally, an additional five years (2017-2021) of monthly observations are added versus the latest period used by Arnott et al. (2018).
METHODOLOGY
This study utilizes three approaches to investigate whether active managers can outperform their benchmark and the presence of performance persistence in the global landscape of active equity managers. The first approach ranks managers’ products into quartiles and tracks the quartile ranking in the subsequent period by estimating the unconditional transition matrix, also known as contingency tables. The second approach is regressionbased and uses pooled data over managers’ products and time to estimate the relationship between contemporaneous and lagged performance. In addition to the pooled regression, logistic regression is used to estimate the probability of active managers generating top-quartile performance across multiple horizons. Using a probability measure instead of statistical significance can offer investors a better understanding of how successful selection can be based on past performance. The third approach follows a common recursive portfolio approach. Portfolios consist of managers’ products grouped in quartiles: Q1 (Winners) till Q4 (Losers) based on a performance measure of the previous period t (sorting period). Then the performance for each (equal-weight) quartile portfolio is tracked in the subsequent period t+1 (holding period). This procedure is repeated after each period.
COSTS
The recursive portfolio approach analyzes if a strategy, based on past performance, can generate positive performance in practice and, most interestingly, on a net basis. Therefore, management fees, transaction, and commission costs are applied. Other possible costs associated with manager replacement (e.g., search costs) are left out. The management fees (see Table 1, second-last column) are the median quoted flat fees per annum in basis points (bps) per universe within the database eVestment. The quoted fees are applicable for a segregated account mandate of the size of USD 500 million, and have an average across universes of 57 bps. The equity transaction and commission costs are taken from the first quarter 2022 report of Virtu Financial5 and are the average quarterly costs over the sample period 2014 Q1 till 2022 Q1. The last column in Table 1 reports the average one-way total trading costs, including transaction and commission costs per universe in basis points, with an average of 52 bps. The total impact of trading costs on the recursive portfolio approach strategy depends on the managers’ turnover in each quartile portfolio, besides the region and market capitalization.
X-FACTOR ALPHA ESTIMATION
Rolling window regressions are used to estimate the X-factor alphas, estimated by Feasible Generalized Least Squares (FGLS) of gross excess returns on a specific set of factors. This study uses two sets of factors: one for emerging and one for developed markets. Both sets consist of six well-known equity style factors; hence, the X-factor model and alpha can be identified as the 6-factor model and alpha. The 6-factor model for emerging markets consists of the Fama-French 5-factor model6 plus the momentum factor.7 The 6-factor model for developed markets consists of the Fama-French 3-factor model8 with a revision of the High-minus-Low (HML) factor9 plus the momentum, Quality-minus-Junk (QMJ),10 and Betting-Against-Beta (BAB)11 factors.12 After estimating the model, the constant (alpha) is often seen as the quality or skill of an active manager to generate riskadjusted returns above the given benchmark. The procedure by Kosowski et al. (2006) is followed as they point out the importance of ranking managers on the t-statistics of the alpha instead of on the alpha itself due to the non-normality of the excess returns. Therefore, the estimated 6-factor alpha and the accompanied t-statistic are used to rank and track subsequent performance for transition matrices, pooled regressions, and the performance of ranked portfolios.
DATA DESCRIPTION
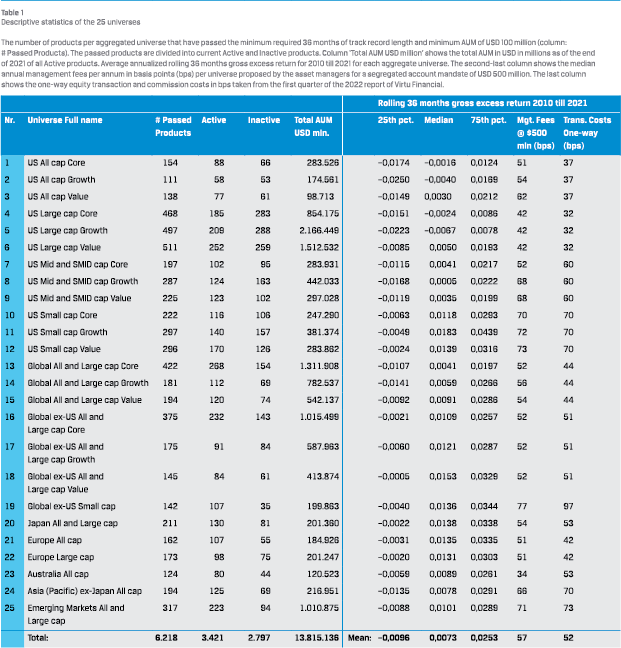 This study is based on performance data from the commercial database eVestment from January 2010 to December 2021. The database is an often used platform within the institutional investment industry instead of the more retail-focused mutual fund databases. The track records of long-only active equity products are predominantly GIPS compliant. The self-reported historical monthly returns of the products are primarily composite returns of the flagship product of the asset managers. This data includes current active as well as inactive products, which solves some of the well-known and extensively documented survivorship bias in previous literature (e.g., Brown et al. (1992), Elton et al. (1996)). Another bias from a database that relies on self-reporting is backfill bias. This bias can be part of an incubation strategy of investment management firms, which is thoroughly described by Evans (2010). Backfill bias primarily affects the excess return rather than the alpha, as managers tend to display their best excess returns rather than alphas. The significant presence of backfill bias in the data before 2010 led to the selected period. This sample comprises 6,218 actively managed equity products across 25 different equity universes of active equity managers worldwide. These products are categorized by region, market capitalization, and style based on eVestment categories and subcategories. As of December 31, 2021, there are 3,421 active products representing a total AUM of $13.8 trillion as of December 31, 2021 (Table 1). These long-only products are actively managed against a benchmark, unlike passive products that track a given benchmark’s performance.
Only products reporting gross returns are included, as the focus is on the manager’s investment skill or performance persistence and not the fee load, which can result from the manager’s negotiation skills or marketing techniques. Furthermore, the sample consists of products with more than USD 100 million at any moment in time over the lifetime of the product and a minimum return history of 36 months. The average median gross excess return over all universes from 2010-2021 is 0.73%. Incorporating management fees would result in an average median net excess return of 0.16%, hence still positive. Of the 25 universes, only two, U.S. All and Large Cap Core and U.S. All and Large Cap Growth, showed average median negative returns during the analyzed period.
ANALYSIS AND RESULTS
TRANSITION MATRICES
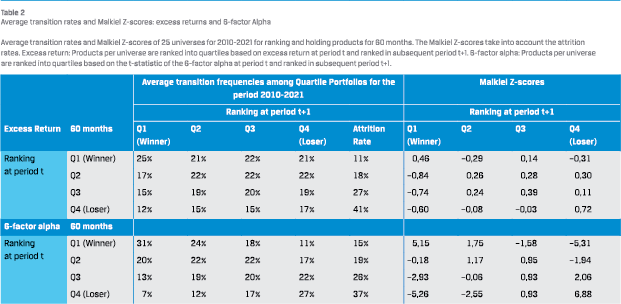 The transition frequency tables show how often products sorted on a performance measure transfer from one quartile into another quartile bucket. Products are assigned to four quartiles Q1-Q4. Products that receive the highest ranking (Winners) are assigned to bucket Q1, while products with the lowest ranking (Losers) are assigned to Q4. If the transitions were random, the transfer from one quartile to any other quartile bucket would have a likelihood of 25%. Performance persistence indicates that these likelihoods deviate from random and are mostly statistically higher on the diagonal, e.g., Winner products at ranking period t end up in the Winner bucket at time t+1 with a higher probability than what randomness dictates. Because products can also be liquidated, it is less obvious how high a transition percentage should be to be statistically significant. Therefore, the Malkiel Z-score is calculated for each part of the transition matrix to account for the attrition rate and identify any significance based on the method proposed by Malkiel (1995).
Table 2 presents the average transition and attrition rates and Malkiel Z-scores of the 25 universes based on excess returns (upper panel) and the 6-factor alpha (lower panel) for ranking and holding the products for 60 months. The Malkiel Z-scores on excess return show no statistical evidence of performance persistence, as the scores are close to zero. The average transition matrices for the 6-factor alpha show statistically significant performance persistence, primarily among the Loser and Winner quartiles. The negative Z-scores on the outer corner of the reverse diagonal emphasize the performance persistence among the Loser and Winner products. It is interesting to note the high attrition rates among the Loser products over 60 months for both performance measures: excess returns (41%) and 6-factor alpha (37%), while the Winner products’ attrition rate is only 11% and 15%, respectively.
 POOLED REGRESSIONS
The performance of all products within a universe over different periods is pooled together to estimate the forecast ability. The pooled regression estimates the relationship between past performance on subsequent 60 months’ performance and is an in-sample regression with overlapping data. Heteroscedastic and autocorrelation-corrected standard errors are applied to correct for overlapping data. The untabulated pooled regression shows mixed results based on excess return, whereas the results for the 6-factor alpha show positive statistically significant results for each universe, indicating performance persistence. The evidence of the 6-factor alpha performance persistence on all universes corresponds with the findings of Arnott et al. (2018) on U.S. data. The evidence of mean reversion in the excess returns for U.S. universes also echoes the findings of Arnott et al. (2018).
 THE PROBABILITY OF SELECTING A TOP-QUARTILE MANAGER
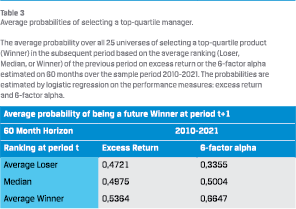
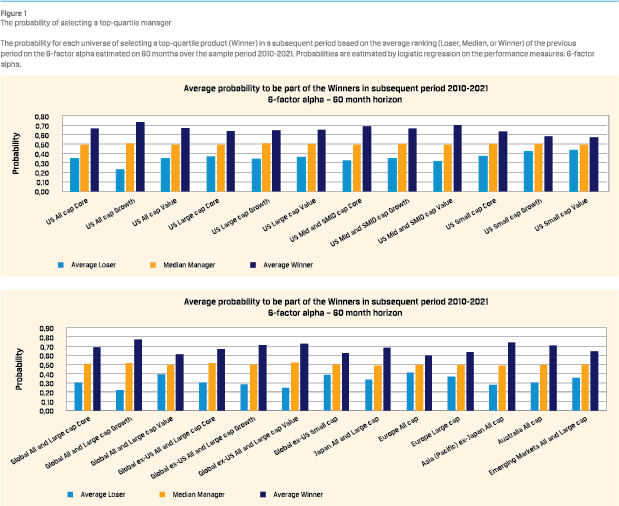
Table 3 presents the average probability over all 25 universes that the average Winner, Loser, or Median product, based on the sorting performance measure, will end up as a Winner on the same performance measure in the subsequent period, similar to Harlow and Brown (2006). The probability for the average Loser to become a Winner using a time horizon of 60 months based on excess return (0.4721) is statistically indistinguishable from the probability of the average Winner (0.5364) to remain a Winner in the subsequent period. Based on the 6-factor alpha, the probability for the average Loser to become a Winner over the same period (0.3355) is statistically different from the probability of the average Winner (0.6647) to remain a Winner in the subsequent period. This finding suggests that performance persistence exists for the 6-factor alpha and not for excess returns. Figure 1 shows the average probabilities for the average Loser and Winner to be part of the Winners quartile in the subsequent period based on the 6-factor alpha for each universe. The highest probability is for the Global All and Large Cap Growth universe, which is 0.7672. On the other hand, the lowest probability is for the US Small Cap Value Universe, which is 0.5725.
RECURSIVE PORTFOLIO
In the recursive portfolio approach, portfolios consist of managers’ products grouped in quartiles: Q1 (Winners) till Q4 (Losers) based on a performance measure of the previous period t (sorting period): excess return or 6-factor alpha. Then the performance for each (equal-weight) quartile portfolio is examined in the subsequent period t+1 (holding period) for different ranking and holding periods from one month to five years. This procedure is repeated after each period. Then the hypothesis that Winners quartile portfolios generate higher performance than Losers quartile portfolios is tested with a standard two-sample t-test.
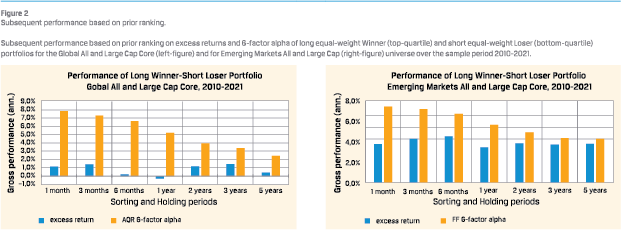 Figure 2 shows the subsequent performance of prior ranking on long equal-weight Winner (Q1) and short equal-weight Loser (Q4) portfolios for the Global All and Large Cap Core (leftpanel) and the Emerging Market All and Large Cap (right-panel) universe on multiple horizons of sorting and the same holding period. The two figures are also exemplary for all other universes, showing that the performance difference between Winners and Losers portfolios mainly decreases when the evaluation horizon increases. The performance of the long Winner-short Loser portfolios based on sorting on prior excess return, however, in most universes, is statistically insignificant when the evaluation horizon is equal to or greater than two years, based on a standard two-sample t-test. The subsequent performance of the long Winner-short Loser portfolio based on the prior 6-factor alpha also declines as sorting and holding periods increase but remains positive and statistically significant in most universes, even on longer horizons of three and five years. This phenomenon leads to the idea that excess return is persistent on the shorter holding periods, primarily up to one year. The 6-factor alpha is even persistent on longer horizons, up to five years.
THE ECONOMIC SIGNIFICANCE OF SELECTING TOP-QUARTILE MANAGERS
Finally, the economic significance of selecting the top-quartile (long Winner) managers’ products is analyzed using the recursive portfolios method, incorporating median management fees and average rebalancing (transaction) costs from Table 1 associated with hiring and firing managers after each holding period. Institutional investors tend to prefer a longer-term investment horizon; therefore, the results are presented over the 60-month horizon.
EXCESS RETURN WINNERS
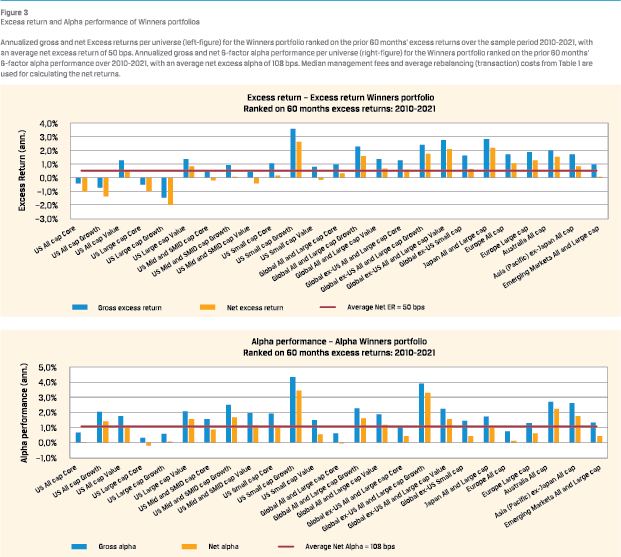
The average annualized net excess return for the 25 universes for selecting the Winners portfolio based on the prior 60 months’ excess returns is 0.50%, as seen in Figure 3 (left figure). The differences between universes, nevertheless, are substantial. Most U.S. universes show net excess returns lower than the average 0.50% and even negative net excess returns, except for U.S. Large Cap Value (0.86%) and U.S. Small Cap Growth (2.62%). Most Non-U.S. universes show positive net excess returns when selected on prior excess returns. Although the average net excess return for the Winners portfolio based on excess return is positive, as mentioned earlier, the difference with the Losers portfolio is not statistically significant for all universes.
 ALPHA WINNERS
The average annualized net 6-factor alpha for the 25 universes for selecting the Winners portfolio based on the prior 60 months’ 6-factor alpha is 1.08%, as seen in Figure 3 (right figure). The annualized net 6-factor alpha for the Winners portfolio ranges per universe between –0.22% (U.S. Large Cap Core) and 3.43% (U.S. Small Cap Growth). The average annualized net 6-factor alpha from the Alpha Winners portfolio (1.08%) exceeds the average annualized net excess return for the Excess return Winners Portfolio (0.50%). The 6-factor alpha of the Alpha Winners is also higher than the excess return of the Excess return Winners for almost every universe. These findings suggest that selecting managers based on their past 6-factor alpha may offer more significant benefits than selecting them on their past excess return. There are two universes where the annualized net 6-factor alpha for the Alpha Winners portfolio is negative: U.S. Large Cap Core (–0.22%) and Global All and Large Cap Core (–0.03%). Although these 6-factor alphas are negative, the difference with the annualized net 6-factor alpha for the Loser portfolio –1.47% and –2.43%, respectively, is still highly statistically and economically significant, as is also the case for all the other universes.
CONCLUSION
Active investing continues to be a hot topic among asset owners since doubts remain regarding the added value of active investing. If performance persistence exists, it can help the more informed asset owner select active asset managers that add value in the future. In this context, the research objective was to test the performance persistence hypothesis of institutional asset managers. Historical performance data is used and evaluated based on the X-factor model and excess returns. Another objective was to analyze the performance of active strategies across major geographic regions for different equity market capitalization and styles on a sample that covers the most recent period, 2010-2021.
Based on the transition matrices, pooled and logistic regressions, performance persistence is a statistically significant phenomenon based on the X-factor alpha; this finding is robust for different investment universes and investment horizons. The results of the simple excess return measure differ from those of the X-factor alpha and are generally not directed toward statistically significant performance persistence. This finding should give asset owners more support and faith in the investment belief of active management in listed equities. Nevertheless, it also shows that more sophisticated performance measurement is required compared to the simple excess return.
PRACTICAL IMPLICATIONS
Although the various methodologies and statistical tests found evidence of performance persistence on the 6-factor alpha, it does not necessarily mean that, in practice, the 6-factor alpha Winners add any real value. Therefore, the economic significance of selecting top-quartile managers on the 6-factor alpha is also tested. The test shows that, on average, the topquartile 6-factor alpha products generated an annualized net performance of 1.08% over 2010-2021, based on a 60-month sorting and holding investment horizon. The 1.08%, however, would only be harvested if one could have immunized the factor exposures. Otherwise, the average annualized net excess return was 0.57% based on an equal-weight portfolio among the Alpha Winners. Nevertheless, this result is 0.40% higher in percentage points than the global measured average annualized net excess return of 0.17% for the sample period 2010-2021, which is of economic significance and answers this study’s initial hypothesis.
LIMITATIONS AND RECOMMENDATIONS FOR FURTHER RESEARCH
Most results in this study are based on averages, but investing in all possible top-quartile managers is not feasible as an asset owner. Eventually, a sub-selection of top-quartile managers should be made. Luckily, other non-performance-related manager characteristics and fund characteristics can play a role in selecting the future Winner, according to Clare et al. (2022) and Budiono and Martens (2010). The incorporated management fees and transaction costs are based on medians and averages. If costs turn out to be lower, the net performance will be higher, and vice versa. As an asset owner, it is possible to influence the quoted management fees and costs based on the size of the investment and negotiation skills. It is essential to bear in mind that better past performing managers tend to charge higher fees. Evidence is found that the 6-factor alpha is persistent, but when the excess return of the Alpha Winners is analyzed, the factor exposures mainly reduce the Alpha performance. The economic significance of factor returns through factor exposures on portfolio performance is substantial and interesting for future research regarding how these exposures can be neutralized if desired. Other research limitations include the sample period, which is unique for all investors and will never precisely represent any other historical or future period. The database is based on self-reporting, which can have several well-known discussed biases (e.g., survivorship, backfill, and inclusion bias). However, these biases were mainly mitigated by including inactive products and the chosen period.
Literature
- Arnott, R., V. Kalesnik, and L. Wu. 2018, The Folly of Hiring Winners and Firing Losers, The Journal of Portfolio Management, vol. 45 nr. 1: 71-84
- Asness, C., and A. Frazzini. 2013, The Devil in HML’s Details, The Journal of Portfolio Management, vol. 39 nr. 4: 49-68
- Asness, C. S., A. Frazzini, and L. H. Pedersen. 2019, Quality Minus Junk, Review of Accounting Studies, vol. 24 nr. 1: 34-112
- Bialkowski, J., and R. Otten. 2011, Emerging Market Mutual Fund Performance: Evidence for Poland, North American Journal of Economics and Finance, vol. 11: 118-130
- Brown, S. J., W. Goetzmann, R. G. Ibbotson, and S. A. Ross. 1992, Survivorship Bias in Performance Studies, The Review of Financial Studies, vol. 5 nr. 4: 553-580
- Budiono, D. P., and M. Martens. 2010. Mutual Fund Selection Based on Funds Characteristics, The Journal of Financial Research, vol. 33 nr. 3: 249-265
- Clare, A., M. Sherman, N. O’Sullivan, J. Gao, and S. Zhu. 2022, Manager characteristics: Predicting Fund Performance, International Review of Financial Analysis, vol. 80, 102049
- Cornell, B., J. Hsu, P. Kiefer, and P. Wool. 2020, Assessing Mutual Fund Performance in China, The Journal of Portfolio Management, vol. 46 nr. 5: 118-127
- Cornell, B., J. Hsu, and D. Nanigian. 2017, Does Past Performance Matter in Investment Manager Selection?, The Journal of Portfolio Management, vol. 43 nr. 4: 33-43
- Dyck, A., K. V. Lins, and L. Pomorski. 2013, Does Active Management Pay? New International Evidence, The Review of Asset Pricing Studies, vol. 3 nr. 2: 200-228
- Elton, E. J., M. J. Gruber, and C. R. Blake. 1996, Survivorship Bias and Mutual Fund Performance, The Review of Financial Studies, vol. 9 nr. 4: 1097-1120
- Evans, R. B. 2010, Mutual Fund Incubation, The Journal of Finance, vol. 65 nr. 4: 1581-1611
- Fama, E. F., and K. R. French. 1993, Common Risk Factors in the Returns on Stocks and Bonds?, Journal of Financial Economics, vol. 33 nr. 1: 3-56
- Fama, E. F., and K. R. French. 2010, Luck Versus Skill in the Cross-Section of Mutual Fund Returns, The Journal of Finance, vol. 65 nr. 5: 1915-1947
- Fama, E. F., and K. R. French. 2015, A Five-Factor Asset Pricing Model, Journal of Financial Economics, vol. 116 nr. 1: 1-22
- Frazzini, A., and L. H. Pedersen. 2014, Betting Against Beta, Journal of Financial Economics, vol. 111 nr. 1: 1-25
- Goyal, A., and S. Wahal. 2008, The Selection and Termination of Investment Management Firms by Plan Sponsors, The Journal of Finance, vol. 63 nr. 4: 1805-1847
- Harlow, W. V., and K. C. Brown. 2006, The Right Answer to the Wrong Question: Identifying Superior Active Portfolio Management, The Journal of Investment Management, vol. 4 nr. 4: 1-26
- Jegadeesh, N., and S. Titman. 1993, Returns to Buying Winners and Selling Losers: Implications for Stock Market Efficiency, Journal of Finance, vol. 48 nr. 1: 65-91
- Kosowski, R., A. Timmermann, R. Wermers, and H. White. 2006, Can Mutual Fund ‘Stars’ Really Pick Stocks? New Evidence from a Bootstrap Analysis, The Journal of Finance, vol. 61 nr. 6: 2551-2595
- Malkiel, B. G. 1995, Returns from Investing in Equity Mutual Funds 1971 to 1991, The Journal of Finance, vol. 50 nr. 2: 549-572
- Matallin-Saez, J. C., A. Soler-Dominguez, and E. Tortosa-Ausina. 2016, On the Robustness of Persistence in Mutual Fund Performance, The North American Journal of Economics and Finance, vol. 36: 192-231
- Omori, K., and T. Kitamura. 2022, Managers’ Skills and Fund Flows in the Japanese Mutual Fund Market, Studies in Economics and Finance, vol. 39 nr. 4: 675-696
Notes
- The opinions and analyses presented herein are my own and do not necessarily represents the views of APG Asset Management
- Acknowledgment: This article has significantly benefitted from the discussions with and comments of Hans de Ruiter, Associate professor of Finance and Investments, Vrije Universiteit Amsterdam and CIO Stichting Pensioenfonds TNO, Rijswijk as thesis supervisor for the postgraduate Master’s program VBA Investment Management – Vrije Universiteit Amsterdam School of Business and Economics.
- The X stands for any number of factors used to risk-adjust the excess return.
- The X-factor alpha is the constant of the estimated X-factor model and is mostly seen as the quality or skill of an active manager to generate risk-adjusted returns above a given benchmark.
- Virtu Financial Inc. is a company that provides financial and trading services.
- Fama and French (2015)
- Jegadeesh and Titman (1993)
- Fama and French (1993)
- Asness and Frazzini (2013)
- Asness et al. (2019)
- Frazzini and Pedersen (2014)
- The more refined factors used for developed markets are not available for emerging markets and hence the use of the available emerging markets factors from Kenneth French’s website. For details on the specific mentioned factors see cited articles. Fama-French data can be publicly downloaded from Kenneth French’s website: https://mba.tuck.dartmouth. edu/pages/faculty/ken.french/data_library.html. AQR data can be publicly downloaded from the AQR’s website: https://www.aqr.com/Insights/Datasets
in VBA Journaal door Simon Zijlstra